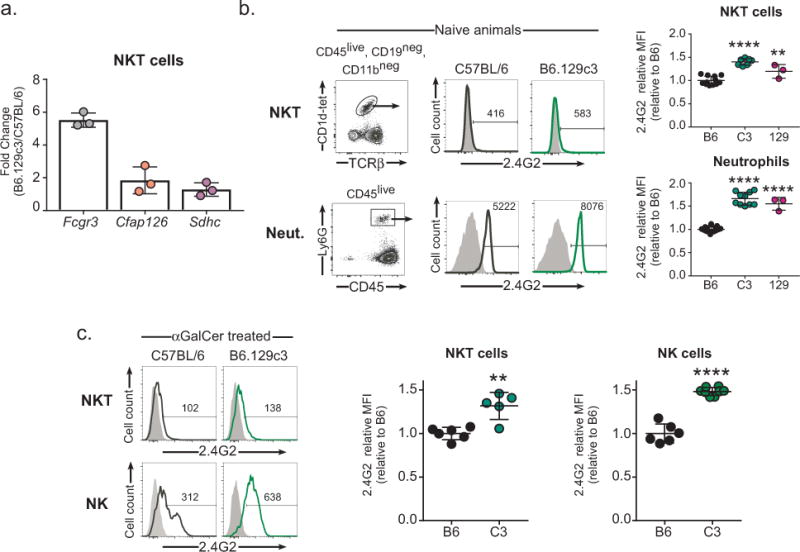
FIGURE 5.

Increased Fcgr3 gene and protein expression on B6.129c3 iNKT cells. A) Increased Fcgr3 gene expression in B6.129c3 splenic iNKT cells. Spleen iNKT cells were sorted using CD1d tetramer/PBS-57 for RNA isolation. Gene expression was determined using quantitative PCR. Data is reported as the fold change relative to B6. B) Increased cell surface protein expression of FcγR3 on naive B6.129c3 iNKT and neutrophils. Representative flow cytometry histograms show expression levels of FcγR3 on B6.129c3 iNKT cells (upper) and neutrophils (lower). Shaded dark histograms represent cells blocked with unconjugated 2.4G2 Ab and subsequently stained with conjugated isotype control. Heavy lined histograms are cells stained with conjugated 2.4G2 Ab. The numbers represent the median fluorescence intensity (MFI). Graphs depict the normalized MFI of 2.4G2 relative to the B6 control. Data represents the mean ± s.d. and is the cumulative data from 2 separate experiments of female mice aged 6-8wks. C) Increased cell surface protein expression of FcγR3 on αGalCer treated B6.129c3 iNKT and NK cells. Shaded dark histograms represent cells blocked with unconjugated 2.4G2 Ab and subsequently stained with conjugated isotype control. Heavy lined histograms are cells stained with conjugated 2.4G2 Ab. The numbers represent the median fluorescence intensity (MFI). Graphs depict normalized MFI of 2.4G2 relative to the B6 control. Data represents the mean ± s.d. and is representative data from 2 independent experiments using 10 or 14 week old female mice. Statistics were performed using a 1-way ANOVA and followed by a post-hoc comparison to B6 controls using Dunnett’s test. **p ≤ .01, ****p ≤ 0.0001
