
Table 1.
Representative examples from different scaffolds of MT-active compounds and their IC50 values vs. T. b. brucei Lister 427 in vitro.
| Compound | Structure |
T. brucei IC50 (nM)[a] |
1h B/P[b] |
|---|---|---|---|
| 1 | 48.17 ± 25 | ND | |
| 8 |  |
3.2 ± 3.0 | 0.07# |
| 9 | 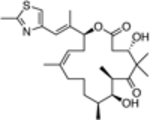 |
163.9 ± 30 | 7.6# |
| 10 |  |
>4,000 | 2.2 |
| 11 |  |
>4,000 | ND |
| 12 | 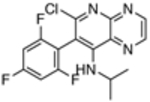 |
>4,000 | ND |
| 13 | 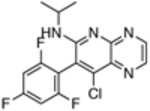 |
>4,000 | ND |
| 14 | 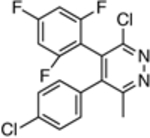 |
3,327 ± 1821 | ND |
| 15 | 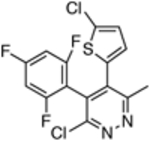 |
2,501 ± 1839 | ND |
| 16 | 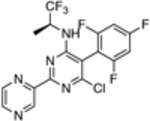 |
109.5 ± 46.9 | 0.58 |
| 17 | 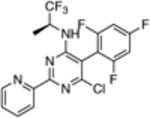 |
66.1 ± 18 | 0.34 |
| 18 |  |
10.9 ± 6.8 | 0.35 |
| 19 |  |
2.5 ± 2.4 | ND |
| 20 |  |
>4,000 | 0.8 |
| 21 |  |
81.3 ± 15 | 0.037 |
| 22 |  |
263 ± 43 | 0.49 |
| 23 |  |
145.8 ± 14.9 | 0.27 |
[a]
Assays were conducted 3 times each in duplicate; the mean and SD for each IC50 value across 6 data points are shown;
[b]
brain-to-plasma (B/P) compound concentration ratio 1 h after an intra-peritoneal (ip) injection of 5 mg/kg of test compound; brain-to-plasma compound concentration ratios are from published studies; [12a, 14]
#
B/P 2 h after an ip injection of 5 mg/kg of test compound.
ND = not determined.