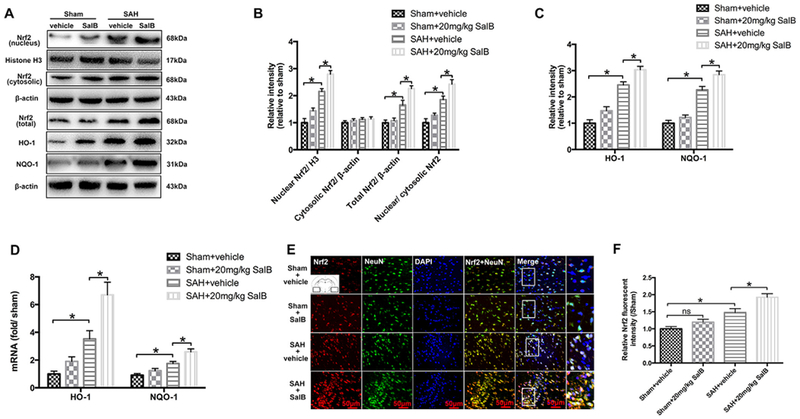
Fig. 4.

Effects of SalB treatment on the Nrf2 signaling pathway in rats at 24 h post-SAH. (A) Western blot analysis for the expression of Nrf2, HO-1, and NQO-1 in the indicated groups. (B, C) Quantitative analyses of Nrf2, HO-1, and NQO-1 in each group. (D) Real-time PCR analysis for HO-1 and NQO-1 expression. (E) Representative photomicrographs of double immunofluorescence staining for Nrf2 and NeuN. (F) Quantification of Nrf2 immunofluorescence staining. Bars represent the mean ± SEM. *P < 0.05; ns, not significant.
