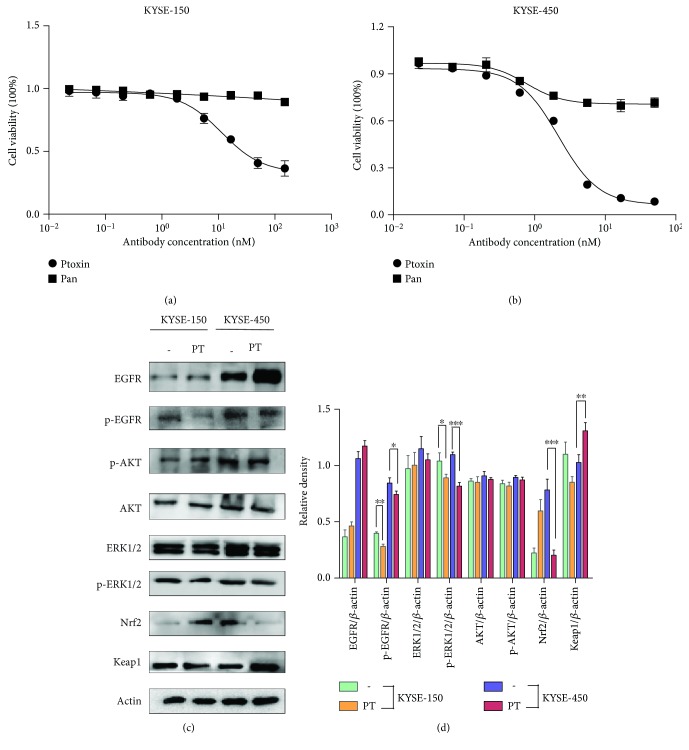
Figure 3.
Treatment with PT inhibited the growth of esophageal cancer cells, and EGFR downstream signaling molecules were examined by western blot. (a) CCK-8 assay showing the inhibitory effects of Ptoxin on growth of KYSE-150 cells. IC50 is 11.43 nM (95% CI: 8.578-15.24 nM) for PT. Bars: SD. (b) CCK-8 assay showing the inhibitory effects of PT on growth of KYSE-450 cells. IC50 is 2.195 nM (95% CI: 1.904-2.532 nM) for PT. (c) Expression of key molecules involved in the EGFR-AKT, EGFR-ERK1/2, and Nrf2-Keap1 signaling pathway was tested in KYSE-150 and KYSE-450 cells upon medium alone (−) or PT (10 nM) treatment for 12 h. (d) Quantification of western blot signal intensity analysis is expressed relative to the β-actin loading control by using the ImageJ software. Data show the mean ± SD (3 independent experiments). ∗ p < 0.05, ∗∗ p < 0.01, and ∗∗∗ p < 0.001.

