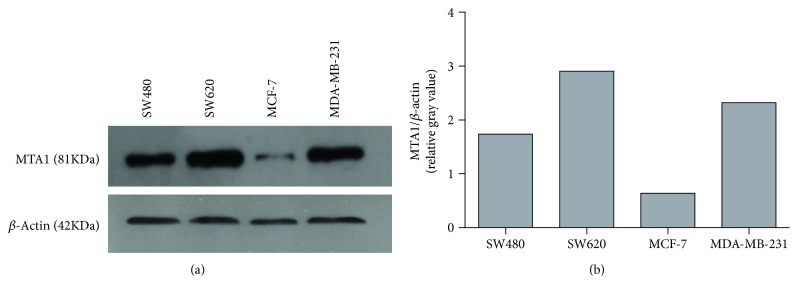
Figure 1.
Protein expression of MTA1 by Western Blot analysis. The protein expression of MTA1 (81 kDa) was evaluated in four human cancer cell lines. β-Actin (42 kDa) was used as loading control, and rabbit polyclonal anti-MTA1 antibody (cat: bs-1412R, dilutions: 1 : 1500, Bioss Antibodies, China) or rabbit polyclonal anti-β-actin antibody (cat: bs-0061R, dilutions: 1 : 50,000, Bioss Antibodies, China) was used in this assay. (a) The bands representing MTA1 and β-actin in each cancer cell line. (b) Gray analysis of the MTA1 protein band intensities (relative to the β-actin band intensity) was carried out by Image J.

