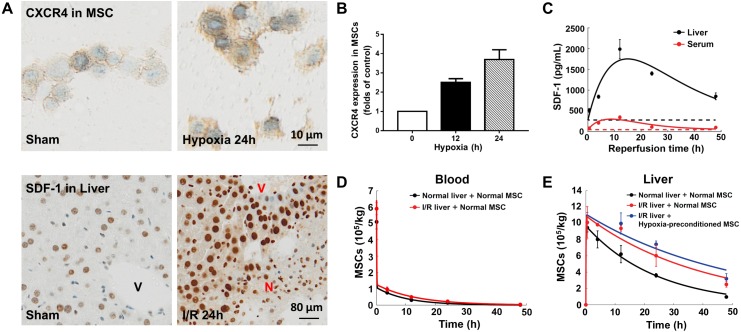
Figure 2. Model calibration results with experimental data.
(A) Representative micrographs of immunohistochemistry for CXCR4 in hypoxia-preconditioned MSCs (3% O2) and SDF-1 in mouse liver with ischemia/reperfusion (I/R) injury. (B) CXCR4 levels in control MSCs and hypoxia-preconditioned MSCs (3% O2). Quantitative ELISA was used for the analysis of CXCR4 levels in MSCs. (C) Model calibration with the SDF-1 concentrations in the blood and liver of mice with hepatic ischemia/reperfusion (I/R) injury. (D) Model calibration with the MSC concentrations in the blood of normal mice and mice with hepatic I/R injury at dose of 5 × 10⁵ cells/animal. (E) Model calibration with the normal and hypoxia-preconditioned MSC concentrations in the liver of normal mice and mice with hepatic I/R injury at dose of 5 × 10⁵ cells/animal. The solid line in each panel represents the concentration-time profile of the SDF-1 and MSCs simulated by the model while the circles represent measured data. Concentrations of the SDF-1 and MSCs are expressed as SDF-1 amount and number of cells per kilogram of tissue. The data are expressed as the sample mean ± one sample standard deviation.

