
Figure 1.
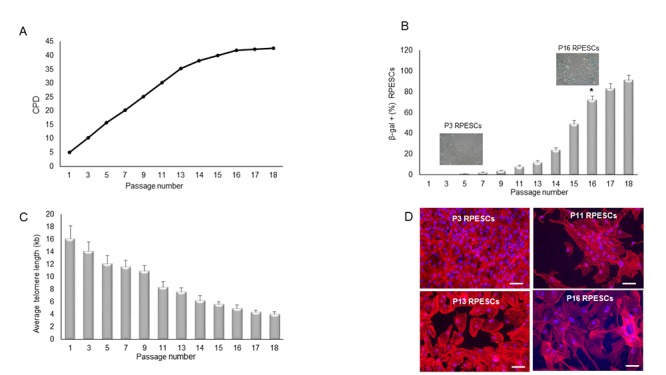
Proliferation rate, β-gal positivity, telomere length, and cell morphology during RPESC replicative senescence. RPESC replicative senescence. (A) Cumulative number of population doublings (CPD) in RPESCs grown to senescence. (B) Percentage of β-gal-positive cells detected during RPESC replicative senescence from P1 to P16. P11, number of culture passages. Data are reported as mean ± SD. *P =0.039. (C) RPESC telomere length during replicative senescence was analyzed from P1 to P18; data are reported as mean ± SD of 3 independent experiments. (D) Morphological analysis of young (P3) and senescent (P16) RPESCs by the TRIC-phalloidin immunofluorescence assay. Senescent RPESCs appear enlarged and flattened. Magnification 20X, scale bar 200 µm. Pictures are representative of 3 independent experiments.