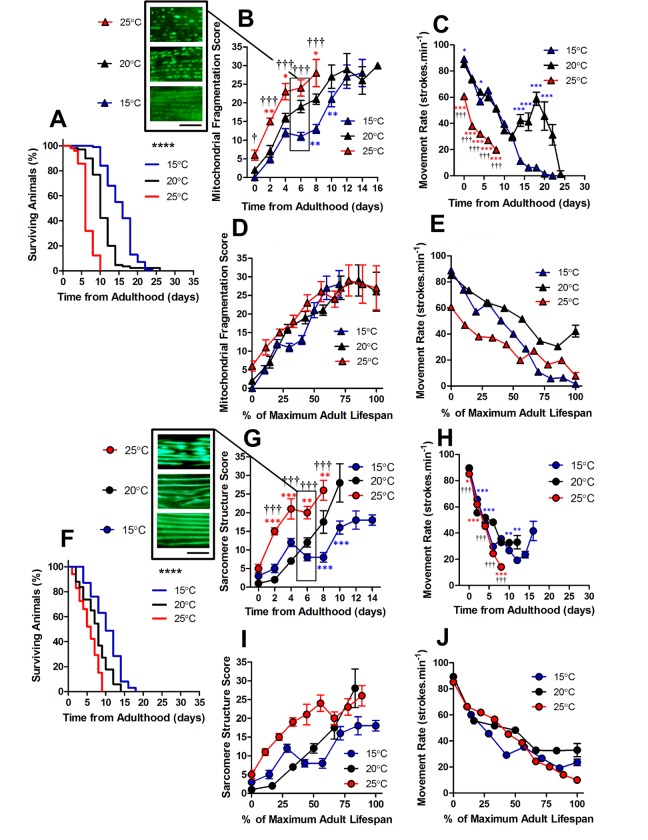
Figure 2.
Changes in lifespan did not change the order of progression of sub-cellular defects in C. elegans. (A) Temperature was used to lengthen (15°C) and shorten (25°C) lifespan in comparison to control (20°C) in animals with GFP-labelled mitochondria (median lifespan of 16d at 15°C vs. 10d at 20°C vs. 6d at 25°C, P<0.0001). (B) Mitochondrial fragmentation is greater at 25°C and lesser at 15°C across the lifespan. (C) Movement across the adult lifespan in GFP-labelled mitochondria is lower in 25C than other temperatures throughout the lifespan. (D) When data were expressed as % maximal lifespan the temporal progression of mitochondrial fragmentation was similar between strains. (E) When expressed as % maximal lifespan, the movement decline between 20°C and 25°C was similar to 50% of maximal lifespan. (F) Temperature was used to lengthen (15°C) and shorten (25°C) lifespan in comparison to control (20°C) in animals with GFP-labelled sarcomeres (median lifespan of 10d at 15°C vs. 8d at 20°C vs. 6d at 25°C, P<0.0001). (G) Decline in sarcomere structure was accelerated in animals at 25°C across the lifespan and sarcomere structure was preserved in 15°C compared to 20°C from 6d onwards. (H) Movement rates in animals with GFP-labelled sarcomeres were lower in animals at 25°C throughout the lifespan (I) Expressing data as % maximal lifespan did not appear to change the relationship between defect progression at different temperatures. (J) Movement expressed as % maximal lifespan shows that the rate of decline scales to lifespan. All data are presented as mean ± SEM. Scale bars in (B) and (G) represent 10 μm.

