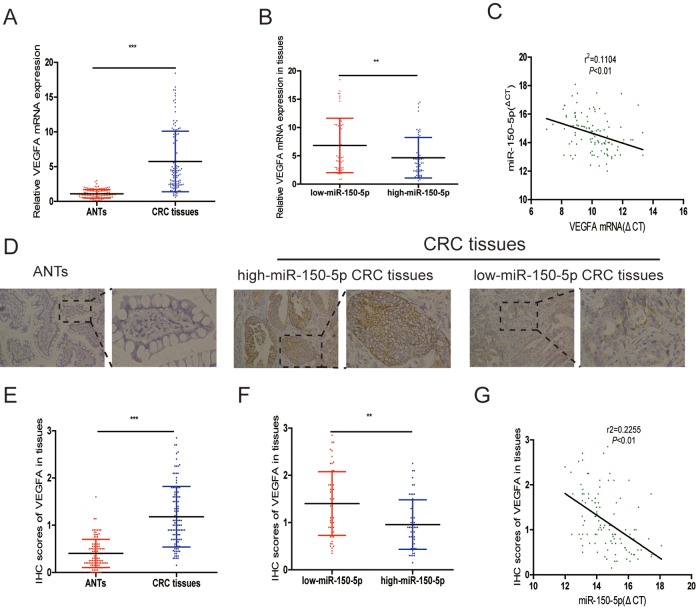
Figure 6.
VEGFA was reversely correlated with miR-150-5p in CRC tissues. (A) qRT-PCR analysis of VEGFA mRNA expression in CRC tissues and matched adjacent normal tissues. (B) Scatterplots of the average VEGFA mRNA expression in patients with low or high expression of miR-150-5p in CRC tissues. (C) The correlation between miR-150-5p levels and VEGFA mRNA levels. (D) Representative images of IHC in adjacent normal tissues, low or high miR-150-5p CRC tissues. (E) The statistical graph showed that the IHC score of VEGFA in CRC tissues was significantly higher than in matched adjacent normal tissues. (F) Scatterplots of the average staining scores for VEGFA expression in patients with low or high expression of miR-150-5p. G. The correlation between miR-150-5p levels and VEGFA protein levels. Data were shown as the mean±SD. **p <0.01, ***p<0.001.

