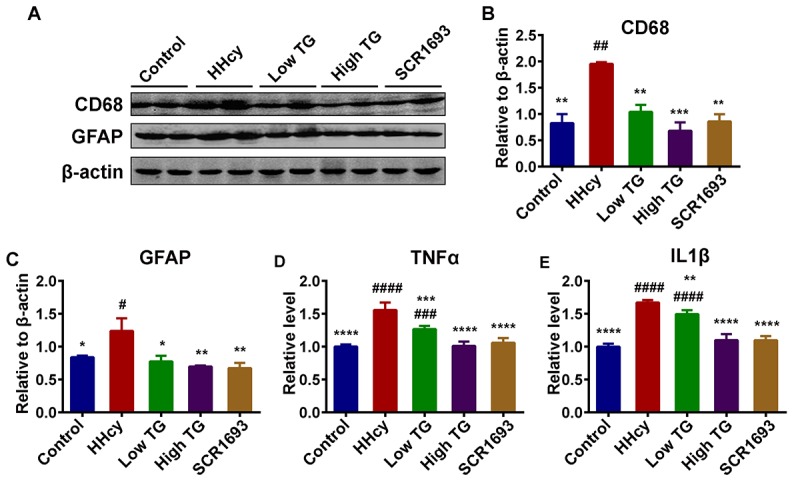
Figure 5.

TG downregulated neuroinflammation induced by Hcy injection in rats. (A-C) Western blots and quantitative analysis of inflammatory markers CD68 and GFAP (n = 6). TG treatment decreased the Hcy-upregulated level of these markers back to control level. (D and E) ELISA results revealed an increased level of inflammatory mediators TNFα and IL1β following Hcy injection and a decrease upon TG supplementation (n = 3). The data were expressed as mean ± SEM. # P < 0.05, ## P < 0.01, ### P < 0.001, #### P < 0.0001 versus control and * P < 0.05, ** P < 0.01, *** P < 0.001, **** P < 0.0001 versus HHcy.
