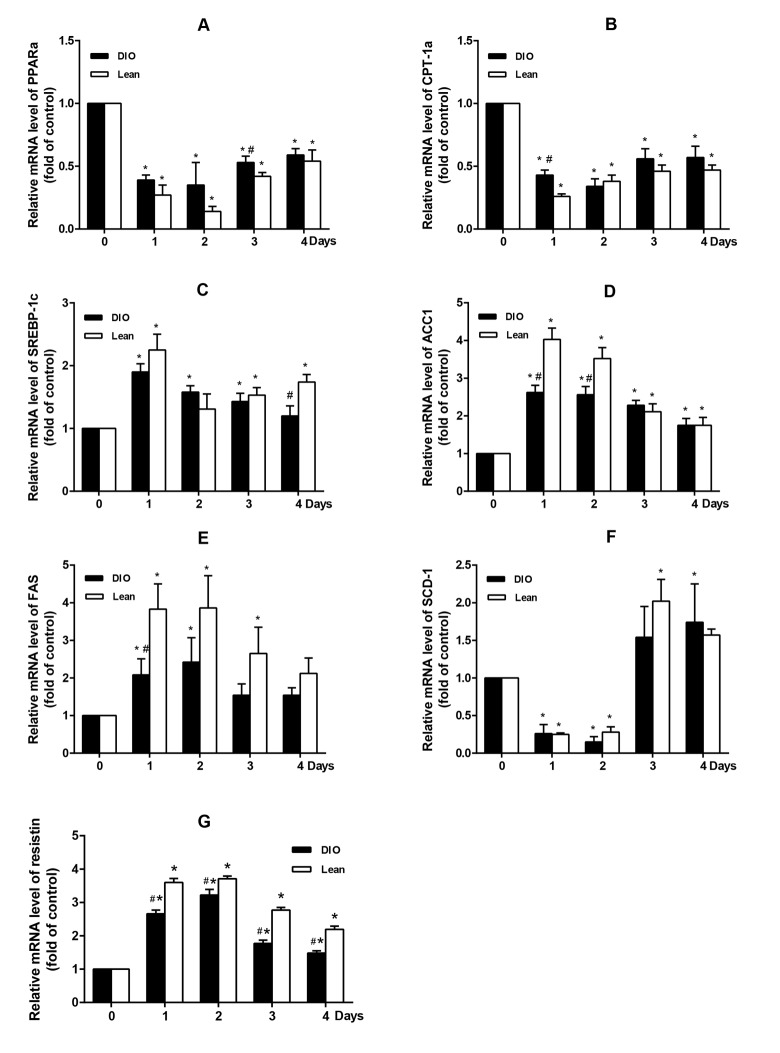
Figure 3.
Effect of E. coli infection on the mRNA expression of hepatic lipid metabolism related genes in the lean and DIO mice by qRT-PCR. (A) PPARα, (B) CPT-1α, (C) SREBP-1c, (D) ACC1, (E) FAS, (F) SCD-1 and (G) Resisin. Values are displayed as mean ± SD (n=6). “*”p<0.05 compared with the control (0 d or pre-infection) within the time of infection; “#”p<0.05 between the lean and DIO mice at the same time point of infection.

