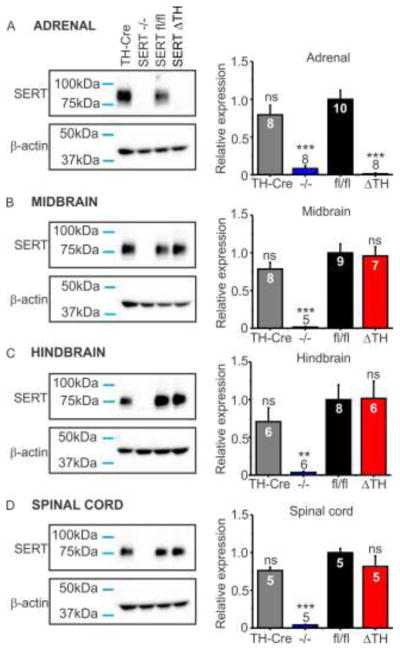
Figure 2. SERT protein expression was abolished from the adrenal gland but remained intact in the CNS of SERTΔTH mice.
SERT protein expression was determined in western blot analyses of tissue isolated from mice with the indicated genotypes: TH-Cre is the parent Th-IRES-Cre driver line (positive control); SERT−/− is the constitutive (global) SERT knockout line (negative control); SERTΔTH and SERTfl/fl are the conditional knockout and floxed control littermates respectively. Representative blots of SERT and β-actin expression (sample loading control) are shown from: A) the adrenal glands, B) midbrain, C) hindbrain, D) thoracic spinal cord. For each sample, SERT expression was normalized to the β–actin loading control and the mean data are expressed as a fraction of the SERTfl/fl control mean (bar graphs). Numbers (n values) denote the number of biological replicates, each from an individual mouse, and in the bar graphs are indicated within the bar of the corresponding genotype. Statistical significance was determined by one-way ANOVA followed by Bonferroni post-test for multiple pairwise comparisons relative to SERTfl/fl. A) In the adrenal gland, SERT expression was detected as a single band (~80 kDa) in TH-Cre and SERTfl/fl mice but was absent from both SERT−/− and SERTΔTH. Quantitative western blot analyses (bar graph) confirmed SERT was absent from the adrenal gland of SERTΔTH mice (F = 28.22, P <0.0001; ns, not significantly different; ***, p < 0.001 compared to SERTfl/fl). B–D) In the CNS tissues tested, SERT expression in SERTΔTH and TH-Cre mice was not significantly different from SERTfl/fl littermate controls but was absent in SERT−/− mice (Midbrain F = 14.62, P < 0.0001; Hindbrain F = 6.05, P = 0.004; Spinal cord F = 28.97, P < 0.0001; ns denotes not significantly different from SERTfl/fl; **, p < 0.01; ***, p < 0.001).

