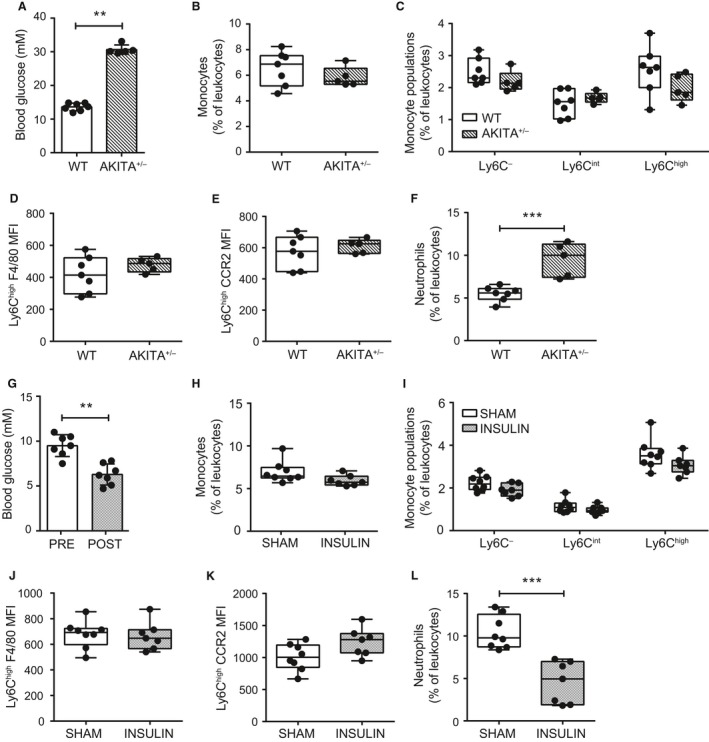
Figure 2.

Ly6Chigh prevalence and phenotype are independent of glucose and insulin in absence of obesity. Peripheral blood monocytes were assessed in chow fed, male WT (n = 7) and Akita+/− (n = 5) mice. (A) random fed blood glucose in WT and Akita+/− mice. (B and C) total monocytes and Ly6C−, Ly6Cint, and Ly6Chigh monocyte subsets as a percentage of total leukocytes (CD45+ cells) in WT and Akita+/− mice. (D and E) Ly6Chigh monocyte F4/80 and CCR2 surface expression in WT and Akita+/− mice. (F) total neutrophils as a percentage of total leukocytes in WT and Akita+/− mice. Effects of hyperinsulinemia on circulating monocytes were assessed in peripheral blood of sham (n = 8) and insulin pellet implanted (n = 7) chow‐fed, WT male mice. (G) random fed blood glucose preimplantation and 2‐weeks post‐insulin pellet implantation. (H and I) total monocytes and Ly6C‐expressing monocyte subsets as a percentage of total leukocytes (CD45+ cells) in mice 2 weeks after sham and post‐insulin pellet implantation. (J and K) Ly6Chigh monocyte F4/80 and CCR2 surface expression. (L) total neutrophils as a proportion of total leukocytes in mice 2 weeks after sham and post‐insulin pellet implantation. Each data point indicates a single mouse. Two‐tailed Mann‐Whitney U tests were used to assess statistical significance between diet groups. Data are presented as box and whiskers plots, minimum to maximum, where the center line represents the median. **P ≤ 0.01, ***P ≤ 0.001. MFI: Geometric Mean Fluorescence Intensity.
