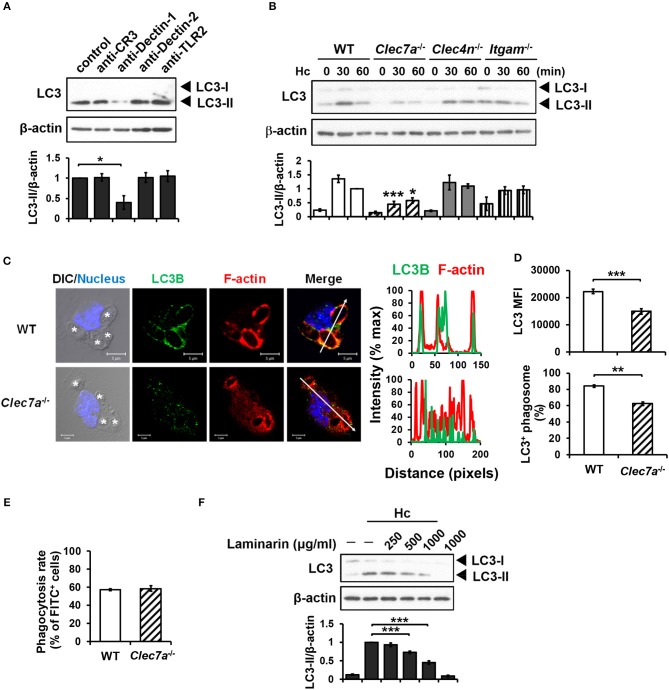
Figure 2.
Dectin-1-mediated recognition is crucial for H. capsulatum-induced LC3-II formation. (A,F) Macrophages from WT mice were treated with blocking antibodies against CR3, Dectin-1, Dectin-2, or TLR2 (10 μg/ml each) (A) or laminarin at indicated concentrations (F) for 1 h prior to stimulation with H. capsulatum (MOI = 5) for 1 h. Cell lysates were extracted and analyzed by Western blotting. (B) Macrophages from WT, Clec7a−/−, Clec4n−/− and Itgam−/− mice were stimulated with or without (0 min) H. capsulatum (MOI = 5) for 30 and 60 min. Cell lysates were subjected to Western blotting. Data shown in the lower panel are relative intensity of LC3-II normalized against the corresponding β-actin, mean ± SEM are shown [n = 3 for (A,B), n = 5 for (F)]. (C,D) Macrophages from WT and Clec7a−/− mice were stimulated with H. capsulatum (MOI = 5) for 1 h. Cells were fixed and stained for LC3B (green), F-actin (red), and the nucleus compartment (blue). Cells were viewed under confocal microscope. Asterisks in the DIC/Nucleus image point to H. capsulatum yeasts. The intensity of different fluorochromes along the white arrow in the merged image is shown as the histogram on the right. The mean fluorescence intensity (MFI) of LC3 in cells engulfing H. capsulatum was quantified. Phagosomes in each cell were counted and the percentages of LC3+ phagosome are shown. Bars represent the mean ± SEM of 3 independent experiments. (E) Macrophages from WT and Clec7a−/− mice were allowed to phagocytose FITC-labeled H. capsulatum (MOI = 10) for 1 h. Percentages of cells taking up H. capsulatum were analyzed by flow cytometry. Mean ± SEM are shown (n = 4). *p ≤ 0.05, **p ≤ 0.01, ***p ≤ 0.001 [ANOVA with Bonferroni's multiple comparisons post-hoc test (A,B,F); 2-tailed t-test (D,E)].

