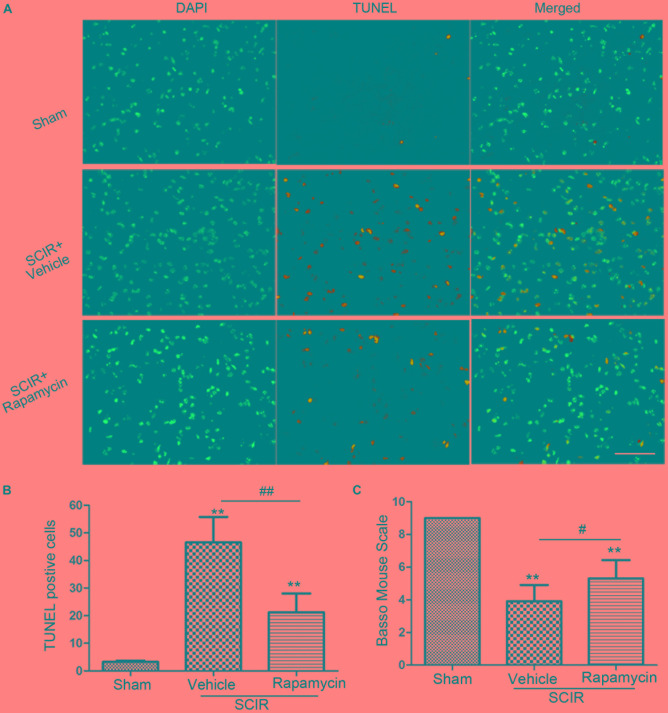
FIGURE 4.
Rapamycin attenuated spinal cord ischemia-reperfusion induced apoptosis. (A). These cells were stained with TUNEL and DAPI. The merged picture shows colocolization of apoptotic and nuclear markers. Scare bar = 50 μm. (B).The bar graph shows rapamycin treatment rescued neurons from apoptosis at 24 h after SCIR. Data were shown as mean ± SD, n = 6. The numbers of apoptotic cells were counted in three sections of ischemic spinal cord. ∗p < 0.05, ∗∗p < 0.01 vs. Sham; #p < 0.05, ##p < 0.01. (C) Bar graphs show the rapamycin-treated mice have significantly higher BMS scores than the vehicle-treated mice at 24 h after injury. Data were shown as mean ± SD, n = 16. ∗p < 0.05, ∗∗p < 0.01 vs. Sham; #p < 0.05, ##p < 0.01.

