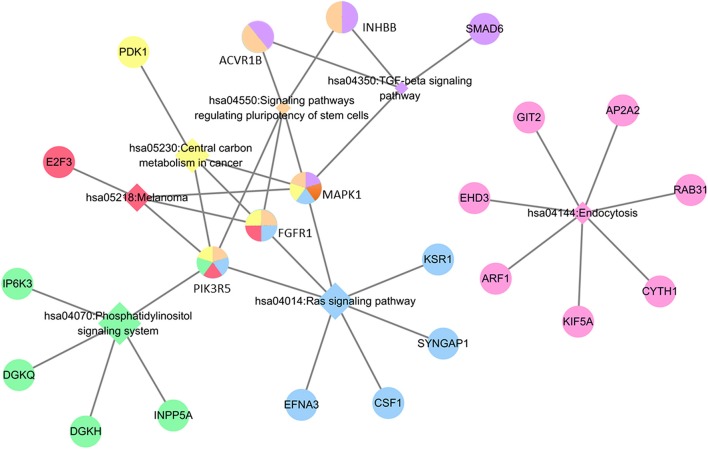
Figure 5.
KEGG analysis of hsa-miR-210 target genes. The circle represents target genes; the diamonds represent signaling pathways. Circles with the same color with diamonds indicate the target genes participating in the corresponding signaling pathways. The relationship between each signaling pathway and each gene is represented by a gray line. The network was generated by Cytoscape_3.5.1.

