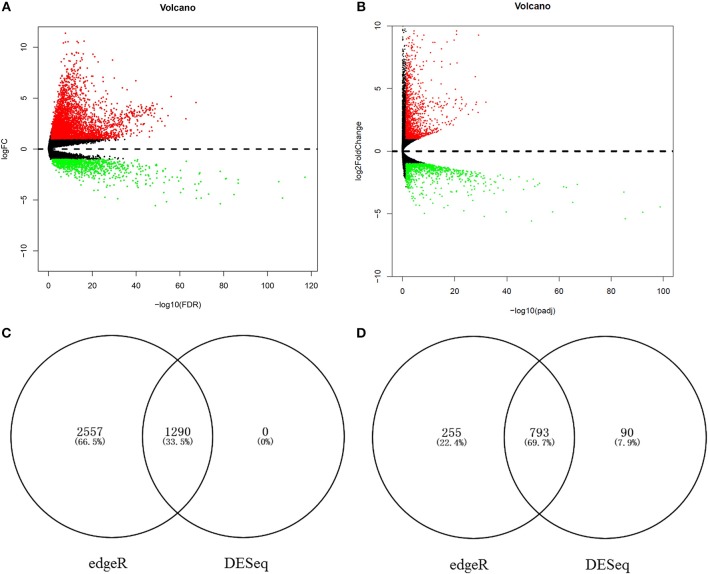
Figure 6.
The aberrantly expressed mRNAs in HCC tissues. Aberrantly expressed miRNAs calculated by edgeR R. 3847 up-regulated and 1048 down-regulated miRNAs were found (A); Aberrantly expressed miRNAs calculated by DESeq R. 1290 up-regulated and 883 down-regulated miRNAs were found (B). Red dots indicate up-regulated miRNAs and green dots indicate down-regulated miRNAs. Black dots show the miRNAs expression with |log2FC| < 1. The X-axis represents an adjusted FDR value and the Y-axis represents the log2FC value. The volcano plot was generated by the ggplot2 package of R language. The intersection of up-regulated mRNAs obtained using edgeR R and DESeq R (C). The intersection of down-regulated mRNAs obtained using edgeR R and DESeq R (D).

