Figure 4.

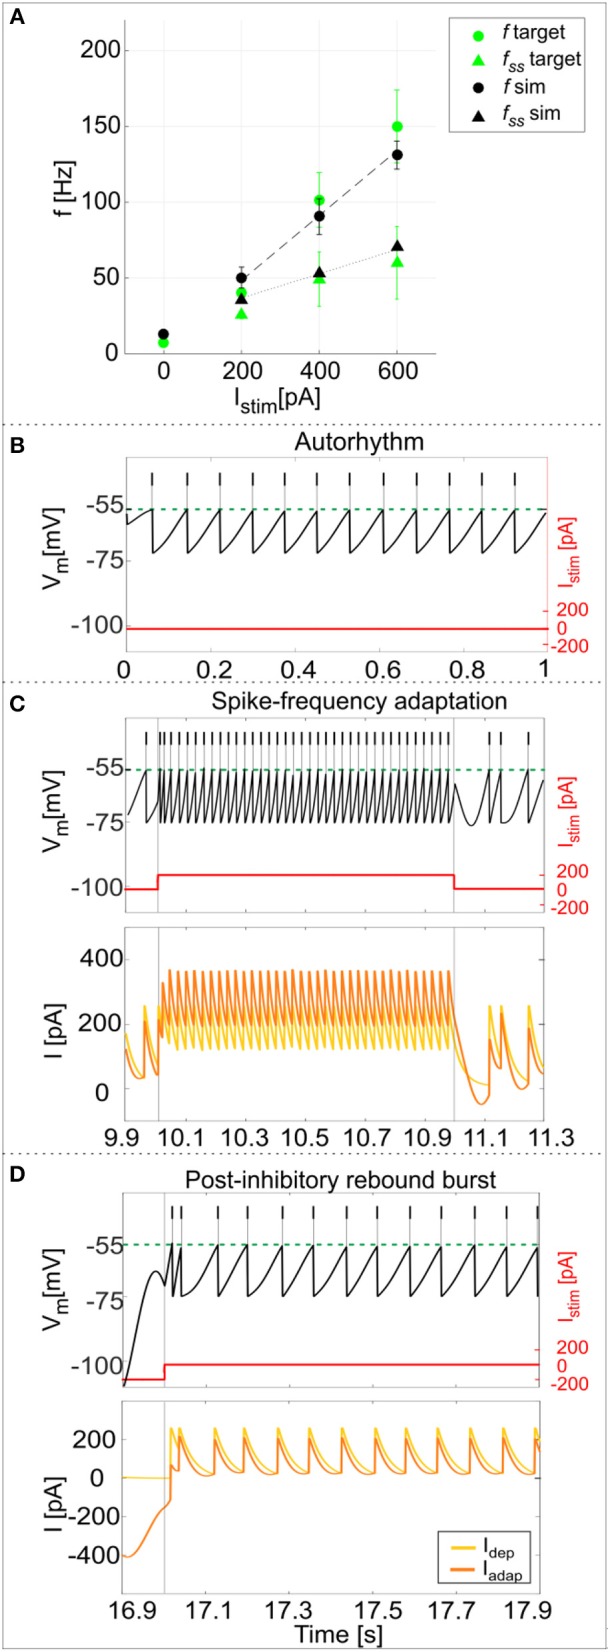
PyNEST simulations. (A) f-Istim relationships. Responses of the optimized GoC neuron during continuous simulations in PyNEST including firing stochasticity. For each stimulation current step (zero-current, 200, 400, and 600 pA lasting 1 second each), the frequency of spiking activity at the beginning (dot markers–f) and at the end (triangle markers–fss) is computed. Black: simulation results (mean and SD across 10 simulation runs, with low variability in the autorhythm and steady state frequencies). Green: target values used in the optimization (mean and SD of the target value distribution). The difference between instantaneous frequencies of the first spikes (f) and of the last spikes at 1 second (fss) is an estimation of the spike-frequency adaptation. (B–D) Model responses to different stimulations. Membrane potential (black), spike events (black lines in the upper part), and the input current (red) in three blow-ups (1 s time windows) along a continuous simulation in PyNEST of the optimized GoC neuron. (B) Autorhythm phase with zero-stimulation current; (C) Depolarization-induced excitation and spike-frequency adaptation during a current step injection of 200 pA. The currents Idep (yellow line) and Iadap (orange line) are plotted along with the membrane potential: Idep is faster and contributes to bursting mechanisms, while Iadap (with lower update rate) generates spike-frequency adaptation reaching its steady-state value after the first 2 spikes following depolarization have already occurred. (D) Rebound doublet after a negative current step of −200 pA, followed by a short quiescent period before returning to tonic firing. Being coupled with Vm, Iadap reaches negative values during hyperpolarization (resulting in a depolarizing effect on Vm), and contributes to the latency of rebound burst when the external inhibitory stimulation stops, while Idep activating after the first spike, sustains the burst.
