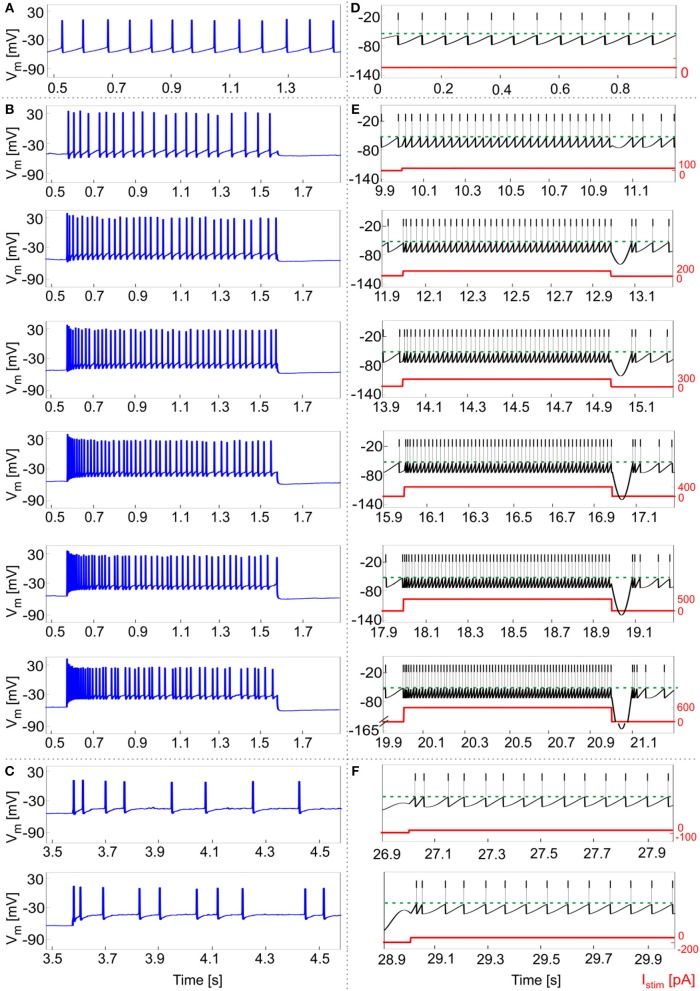
Figure 5.
Responses to current steps. (A–C) Example of GoC membrane potential recorded during in vitro experiments under different step current stimulation protocols. (A) Autorhythm; (B) Depolarization-induced excitation and spike-frequency adaptation with increasing current steps from 100 to 600 pA (with increments of 100 pA); (C) Rebound burst after a negative current step of −100 and −200 pA. (D–E) Simulated spike patterns during 1-s time windows of the multi-phase stimulation protocol, with different input step currents used also in the recordings (red). (D) Autorhythm with ISIs irregularity. (E) Depolarization-induced excitation and spike-frequency adaptation at increasing levels of input current (from 100 to 600 pA, with increments of 100 pA). Reflecting experimental behavior, a clear firing rate increase is present as the stimulation starts, soon decreasing to the steady state value. Both initial and final spiking frequencies are higher with increasing input currents. (F) Post-inhibitory rebound bursting (doublet) following a hyperpolarization of −100 pA (upper panel) and −200 pA (lower panel): bursting properties are enhanced after a stronger inhibitory current step, coherently with experimental results.

