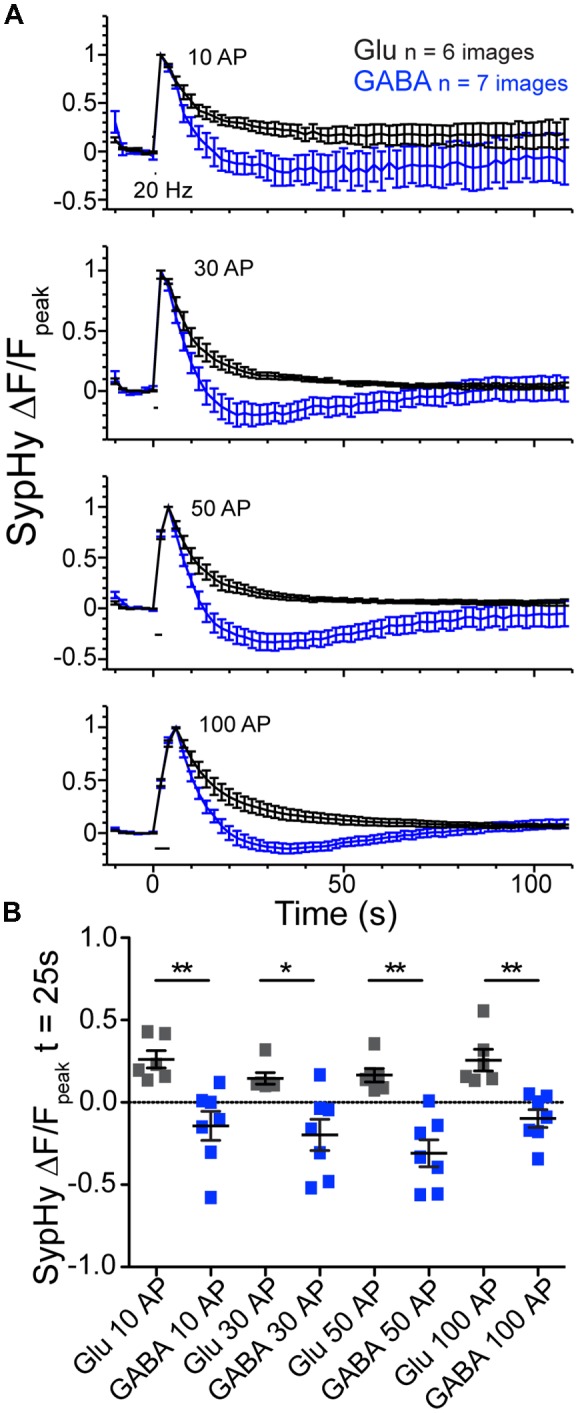
Figure 3.

Glutamatergic and GABAergic synaptic vesicles (SVs) display differences in reacidification processes regardless of stimulus number. (A) Average SypHy fluorescence normalized to peak fluorescence after stimulation in glutamatergic (black) or GABAergic (blue) synapses stimulated with 10, 30, 50 and 100 pulses at 20 Hz. Stimulation duration (20 Hz) indicated by black interval bar. Mean ± SEM, three independent cultures. (B) Scatter plot of SypHy fluorescence normalized to the peak fluorescence for each stimulation train at a time point 25 s post stimulation. Bars = Mean ± SEM. Significance determined by Mann Whitney test. 10 AP, **p = 0.0012; 30 AP, *p = 0.0221; 50 AP, **p = 0.0012; 100 AP, **p = 0.0012.
