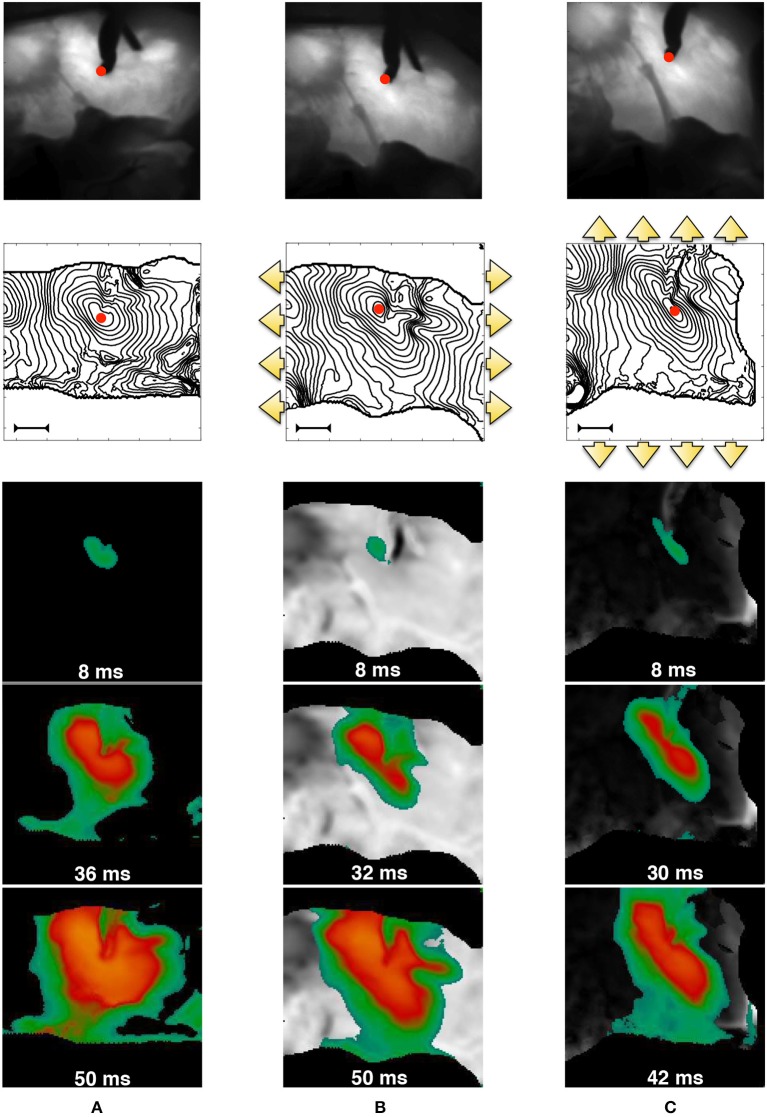
Figure 1.
MEF observed in pig right ventricle via fluorescence optical mapping. From top to bottom, we provide: underlying tissue structure in reference (A) and deformed (B,C) states; activation isochrones each 4ms originating from the stimulation point (red spot in the field of view–the bar indicates a length of 1cm), and activation sequences. The three cases refer to no-stretch (A), static horizontally (B), and vertical (C) stretch in the directions indicated by the yellow arrows. The sequence of spatial activation uses the color code scaled to the AP level (yellow/green–high/low). Selected frames highlight the anisotropy induced by stretch. The outer black region is the noisy area not useful for the field of view.

