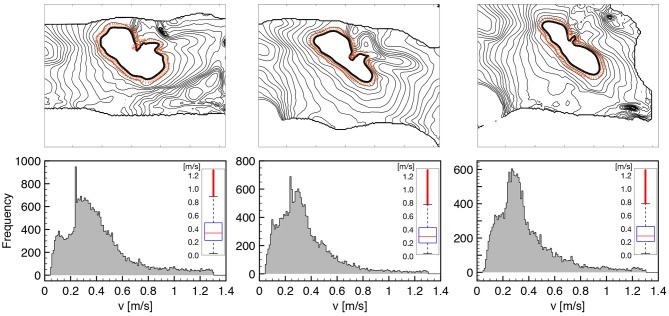
Figure 2.
CV histograms measured on tissue wedges for three different loading states overlapping local measures for seven consecutive activations at constant pacing cycle length of 1s. All the normal directions to the AP propagation are considered as indicated by orange arrows on a representative isochrone contour. The box plot of the distribution is provided as inset for the three histogram, respectively, highlighting the amount of dispersion and the reduction of CV under stretch (see Table 1 for details). Cut-off of spurious values is set at 0.05 and 1.3 m/s.

