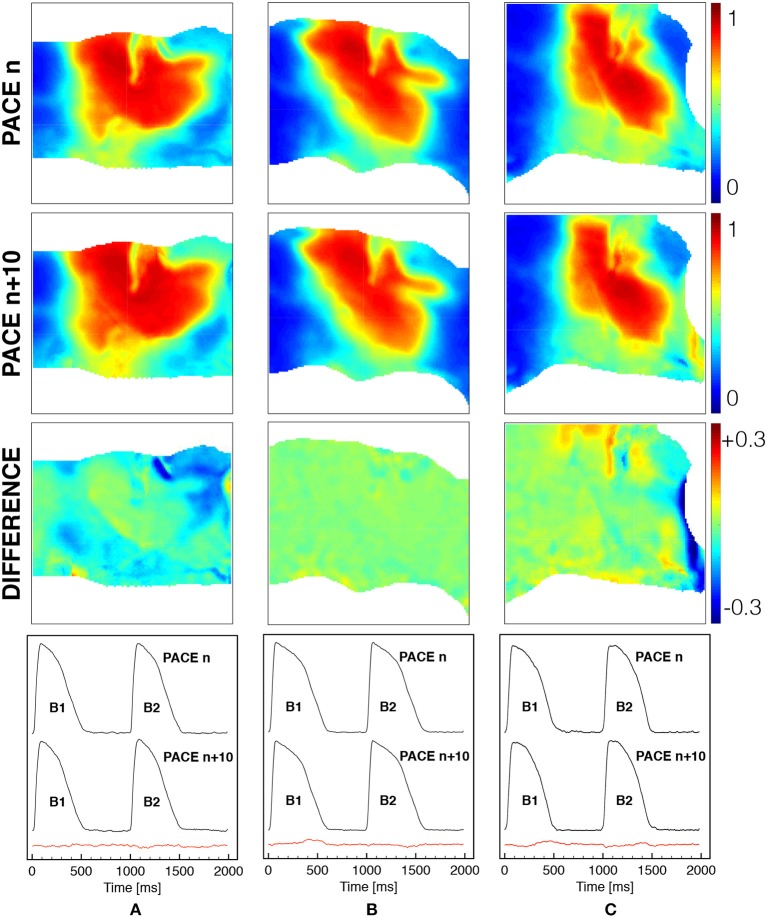
Figure 3.
Spatial and temporal comparison of ventricular activation at constant pacing cycle length of 1s under different mechanical loadings [free (A), horizontal (B) and vertical (C) stretch as in Figure 1]. The first two rows show the spatial distribution of the normalized voltage for beat n and beat n + 10 with the corresponding difference in the third row (color code is indicated). The last row indicates the time course of a representative pixel in the center of the field of view for two consecutive beats n and n + 10 with the corresponding difference provided in the red trace.

