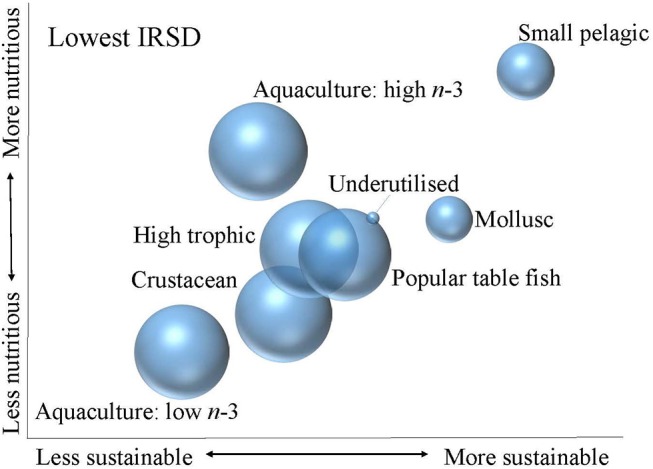
Figure 4.

Relative nutritional quality and sustainability of seafood categories consumed by lowest IRSD group. The size of the bubble indicates the contribution of each seafood category to total seafood consumption within the consumer group, noting that total seafood consumption in the lowest IRSD group was lower than in the highest IRSD group.
