
FIGURE 3.
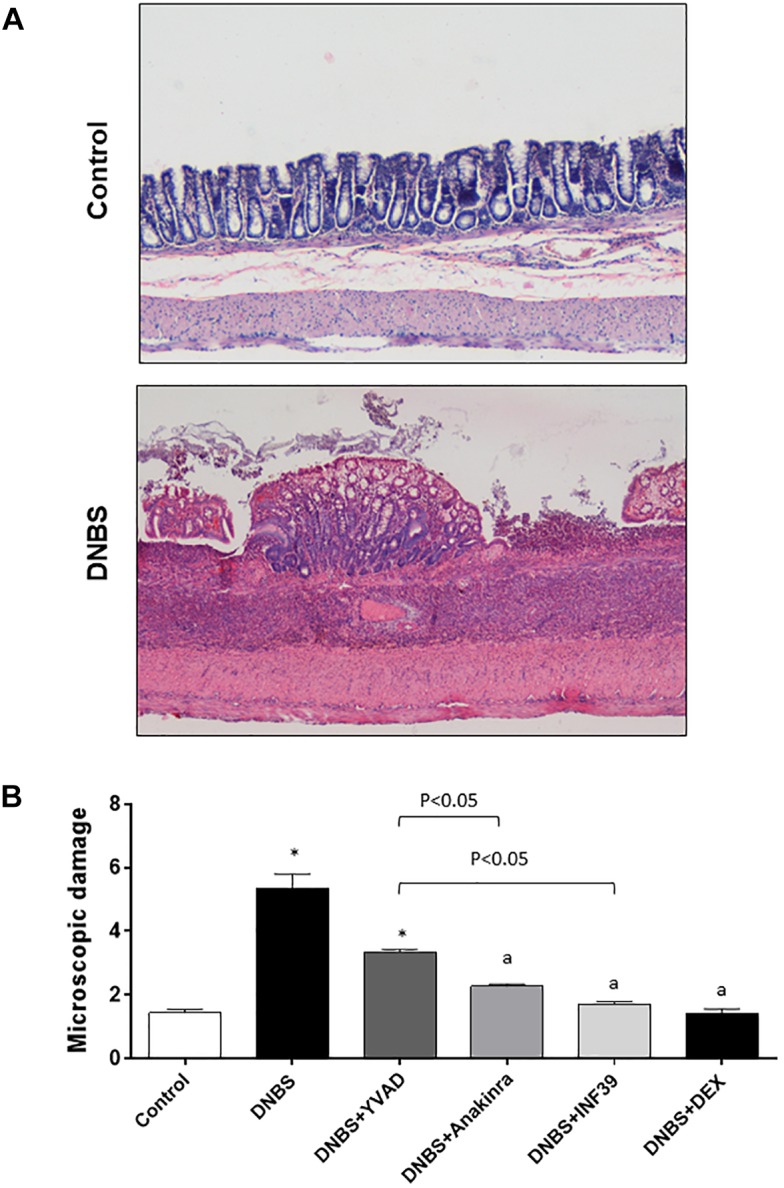
(A) Hematoxylin and eosin-stained sections of rat colon. Representative microscopic images refer to control rats or animals with colitis induced by DNBS. (B) Microscopic damage score estimated for colon in rats under normal conditions or with DNBS-induced colitis, either alone or after treatment with Ac-YVAD-cmk (YVAD, 3 mg/Kg), anakinra (100 mg/Kg), INF39 (25 mg/kg) or DEX (1 mg/kg). Each column represents the mean ± S.E.M. (n = 10). ∗P < 0.05, significant difference vs. control group; aP < 0.05, significant difference vs. DNBS group.