
FIGURE 4.
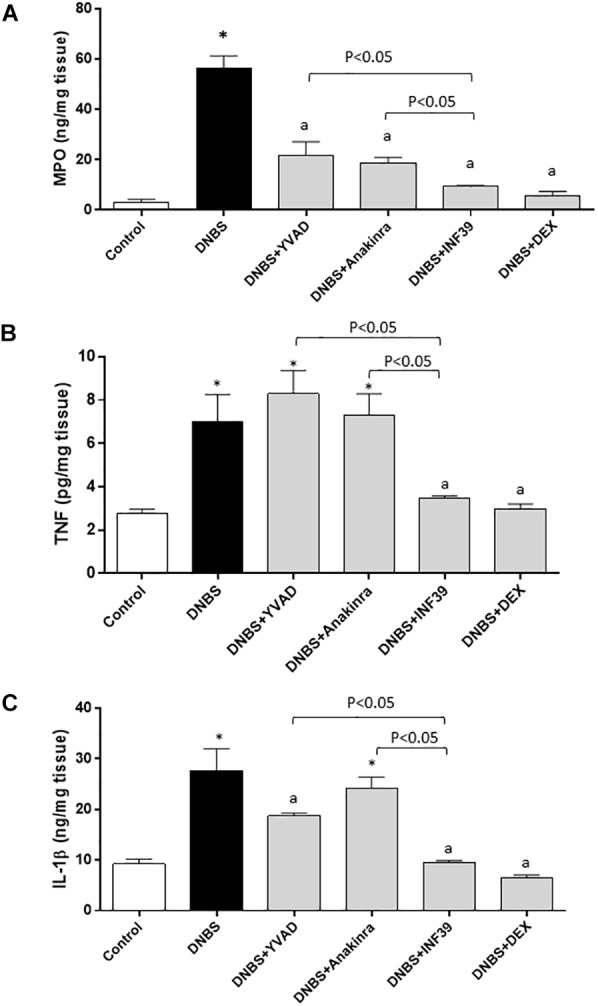
Myeloperoxidase (MPO) (A), tumor necrosis factor (TNF) (B) and interleukin-1β (IL-1β) (C) levels in colonic tissues from control rats or animals with DNBS-induced colitis, either alone or after treatment with Ac-YVAD-cmk (YVAD, 3 mg/Kg), anakinra (100 mg/Kg), INF39 (25 mg/kg) or DEX (1 mg/kg). Each column represents the mean ± S.E.M. (n = 10). ∗P < 0.05, significant difference vs. control group; aP < 0.05, significant difference vs. DNBS group.