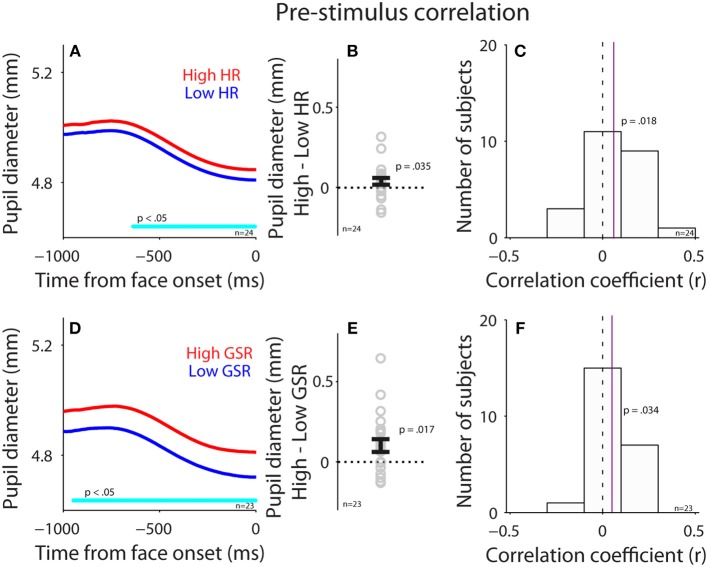
Figure 4.
Correlation between pupil diameter and HR or GSR before face presentation. (A) Pupil diameter following the presentation of face stimuli in higher or lower HR (N = 24). (B) Differences in pupil diameter between higher and lower HR conditions for each individual subject. (C) Distribution of correlation coefficients for the relationship between pupil diameter and HR for all subjects. (D) Pupil diameter following the presentation of face stimuli in higher or lower GSR (N = 23). (E) Differences in pupil diameter between higher and lower GSR conditions for each individual subject. (F) Distribution of correlation coefficients for the relationship between pupil diameter and GSR for all subjects. In (A,D), the cyan bar on X-axis indicates the time line at which differences between the two conditions were statistically significant (p < 0.05). In (B,E), the error-bar represents mean ± standard error across participants. In (C,F), the vertical dotted line represents a zero value of the correlation coefficient (r = 0), and the vertical purple line represents the median value of the correlation coefficient. HR, heart rate; GSR, galvanic skin response; n, number of participants.

