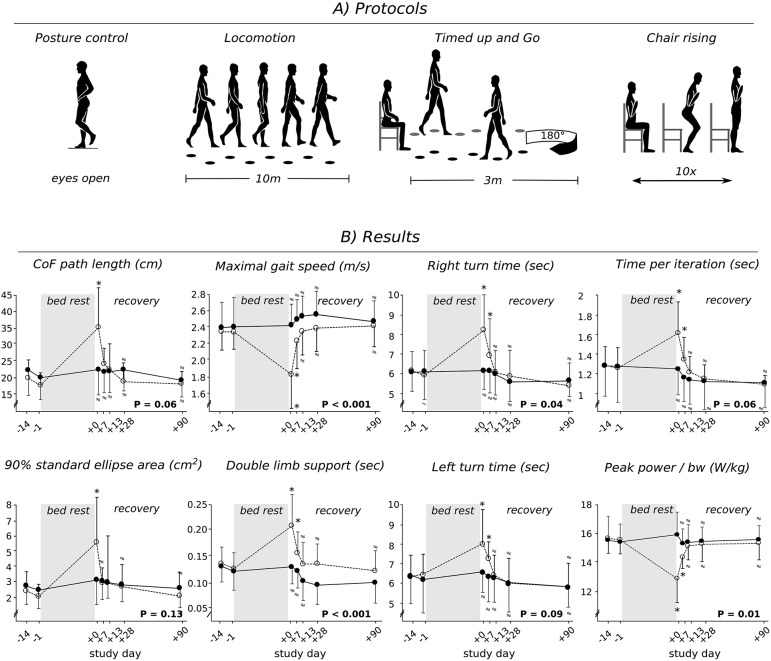
Figure 2.
Protocol schematic (A) and grand means (B) for the inactive CTRL (open circles) and the JUMP group (full circles). Data is displayed for baseline measurements (BDC-14 and BDC-1) and the recovery period (R+0, R+7, R+13, R+28, and R+90) after the 60 days of bed-rest. Changes in center of force (CoF) path length and standard ellipse area in the balance test, gait speed and double limb support, time for the left and right turn for “Timed Up and Go” test, time and peak power chair-rising with respect to baseline (BDC-1). Values are means ± SE. P < 0.05 denotes a significant group*time interaction effect. * indicates a significant difference compared to baseline. If values were statistically non-inferior compared to baseline, they are marked with a ≈ symbol.

