
Figure 1.
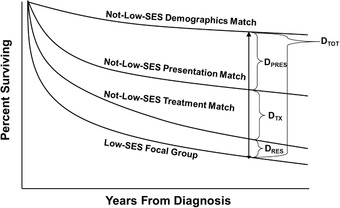
Conceptual Model of Tapered Matching Analyses
Hypothetical Kaplan‐Meier Curves of Breast Cancer Survival for LSES Focal Patients (bottom) and Their 3 Matched NLSES Control Groups: (1) NLSES controls matched only on demographics (age, year of diagnosis, and SEER site) (top); (2) NLSES controls matched on both presentation factors and demographics (eg, tumor stage, size, pathology, patient comorbidities like diabetes and heart failure as well as the demographic variables); and finally (3) NLSES controls matched on treatment variables (eg, surgery, radiation, and chemotherapy) and both presentation factors and demographic variables. Note the size of the total disparity at a specified follow‐up time is DTOT; the disparity associated with differences in how patients present on admission is the DPRES, which is the difference in survival between the control group that is matched on demographics and the control group that is matched on both demographics and presentation factors. The disparity DTX is the difference in survival between the control group that is matched on presentation and demographics factors and the control group that is matched on treatment, presentation, and demographics. If there is any disparity noted after the treatment match, we refer to that as the residual disparity (DRES).