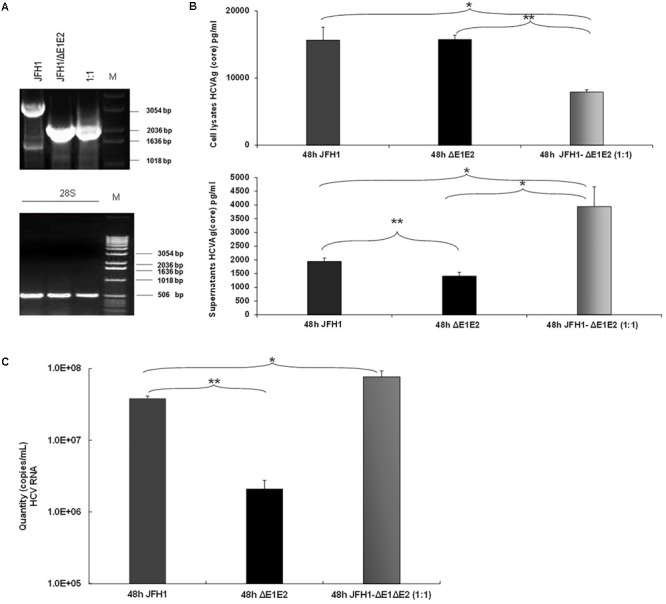
FIGURE 3.

Prevalence of IFDMs in the HCV in vitro cell culture system. (A) Electroporation experiments were performed in Huh7.5 cells using RNA JFH1 or JFH1 ΔE1E2 at ratios 1:1. The 1% (w/v) electrophoretogram depicts amplicons from isolated IFDMs, following RNA isolation and RT-PCR analysis. M, Molecular size marker. (B) HCV Ag (Core) was measured at 48 post-transfection in cell lysates and supernatants using the Abbott ARCHITECT HCV Ag assay. (C) Quantity of viral RNA (viral copies/mL) was measured in the above cell culture supernatants using the SACACE Real Time PCR kit for HCV detection. ANOVA analysis showed statistical significance between samples. ∗p-value ≤ 0.05; ∗∗p-value ≤ 0.005.
