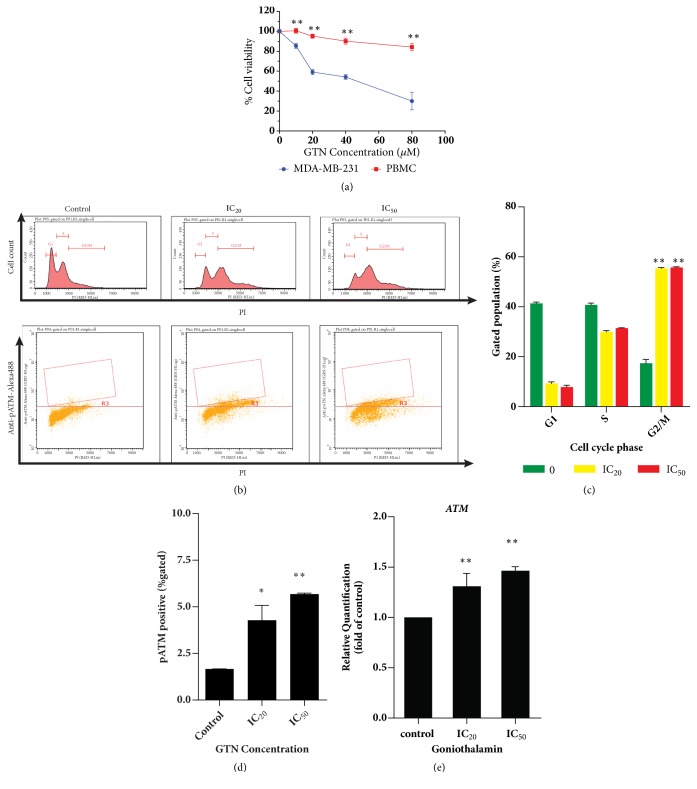
Figure 1.
Cytotoxicity of goniothalamin (GTN) against human breast cancer MDA-MB-231 cells. Percent cell viability (a) of adherent MDA-MB-231 compared with PBMCs as mean ± SD. Cell cycle analysis of MDA-MB-231 cells after treatment with GTN at IC20 and IC50 ((b) upper panel). Dot plot of cells positive for phospho-ATM was accomplished by using specific Guava® Cell Cycle reagent ((b), lower panel). Bar graphs of percent cells in each phase of the cell cycle are shown as mean ± SD analyzed by using Guava® Flow Cytometry easyCyte™ Systems (c). Bar graphs of cells that were positive for phospho-ATM as mean ± SD (d). Bar graphs are presented of ATM gene expression in GTN-treated MDA-MB-231 cells (e). The significance of statistical values compared to control (without treatment) was marked with ∗, p<0.05; ∗∗, p<0.01.

