Figure 2.
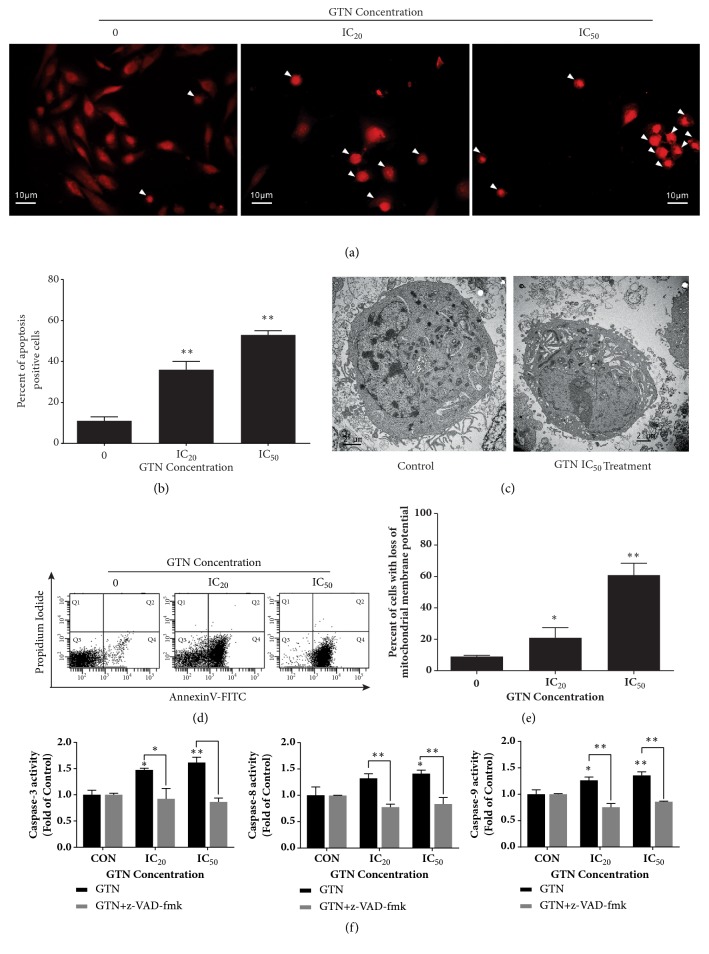
Apoptosis induction by GTN in MDA-MB-231 cells. Cell morphology of apoptotic cells was condensed nuclei and apoptotic bodies (arrows) after staining with propidium iodide (PI) (a). Bar graphs of percent apoptotic cells were obtained from counting positive apoptotic cells stained with PI of total 200 cells in a sample from three independent experiments as mean ± SD (b). A transmission electron micrograph of the representative apoptotic cell that was compared to the normal cell after GTN treatment for 24 h (c). Dot plots of early apoptosis were confirmed by staining with annexin V-FITC and PI employing flow cytometry (d). Bar graphs of early apoptotic cells as evidenced by positive cells for annexin V-FITC as mean ± SD (e). Caspases-3, -8 and -9 activities increased dose dependently after being incubated with GTN at IC20 and IC50 for 24 hours and they were then compared to control. The three caspase activities were attenuated by pre-treatment for an hour with z-VAD-fmk at the concentration of 10 μM (f). The significance of statistical values compared to control (without treatment) was marked with ∗, p<0.05; ∗∗, p<0.01.

