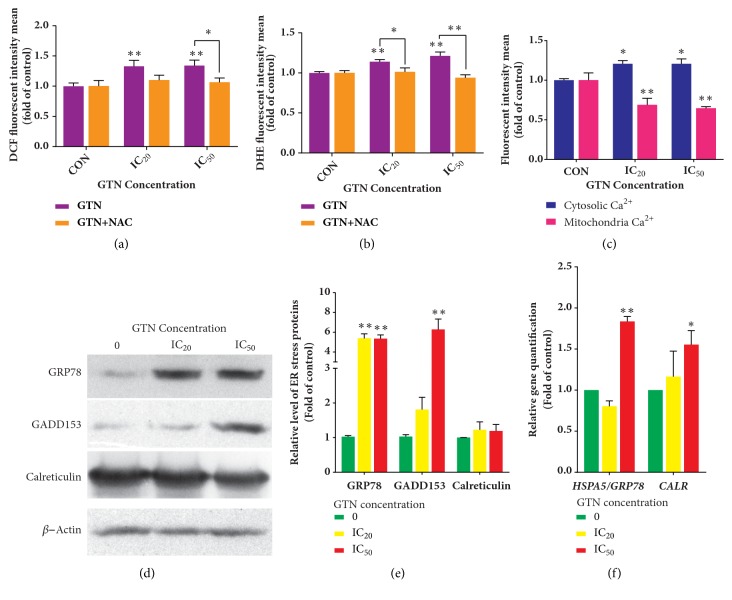
Figure 4.
Reactive oxygen species (ROS) production and alteration of endoplasmic reticulum (ER) Calcium ion levels and ER protein expressions. ROS generation is exhibited as mean ± SD of fluorescence intensity in folds compared to that of the control (without treatment) from three independent experiments by using fluorescence probes: DCFH-DA (a) and DHE (b) measured by a fluorescence microplate reader. N-acetylcysteine (NAC) was used to confirm the oxidative stress involvement in the signaling pathway. ER stress was determined by Ca2+ ion level determination probes in the cytoplasm and mitochondria. ER stress was exhibited as evidenced by the increased levels of Ca2+ in the cytosol and decreased in the mitochondria. The data were shown as mean ± SD of fluorescence intensity as folds compared to the control (without treatment) from three independent experiments (c). The ER chaperone protein expression levels, GRP78, GADD153, and Calreticulin, were illustrated by Western blotting after MDA-MB-231 cells were treated with GTN at IC20 and IC50 for 24 hours (d). The densitometry of protein bands was calculated by Image J Software and is shown as mean ± SD of three independent experiments (e). Bar graphs of mRNA relative levels of HSPA5/GRP78 and CALR by real-time RT-PCR and results were calculated by using the ∆∆Ct method for relative quantifications. The data are presented as mean ± SD from three independent experiments (f). The significance of statistical values compared to the control (without treatment) was marked with ∗, p<0.05; ∗∗, p<0.01.

