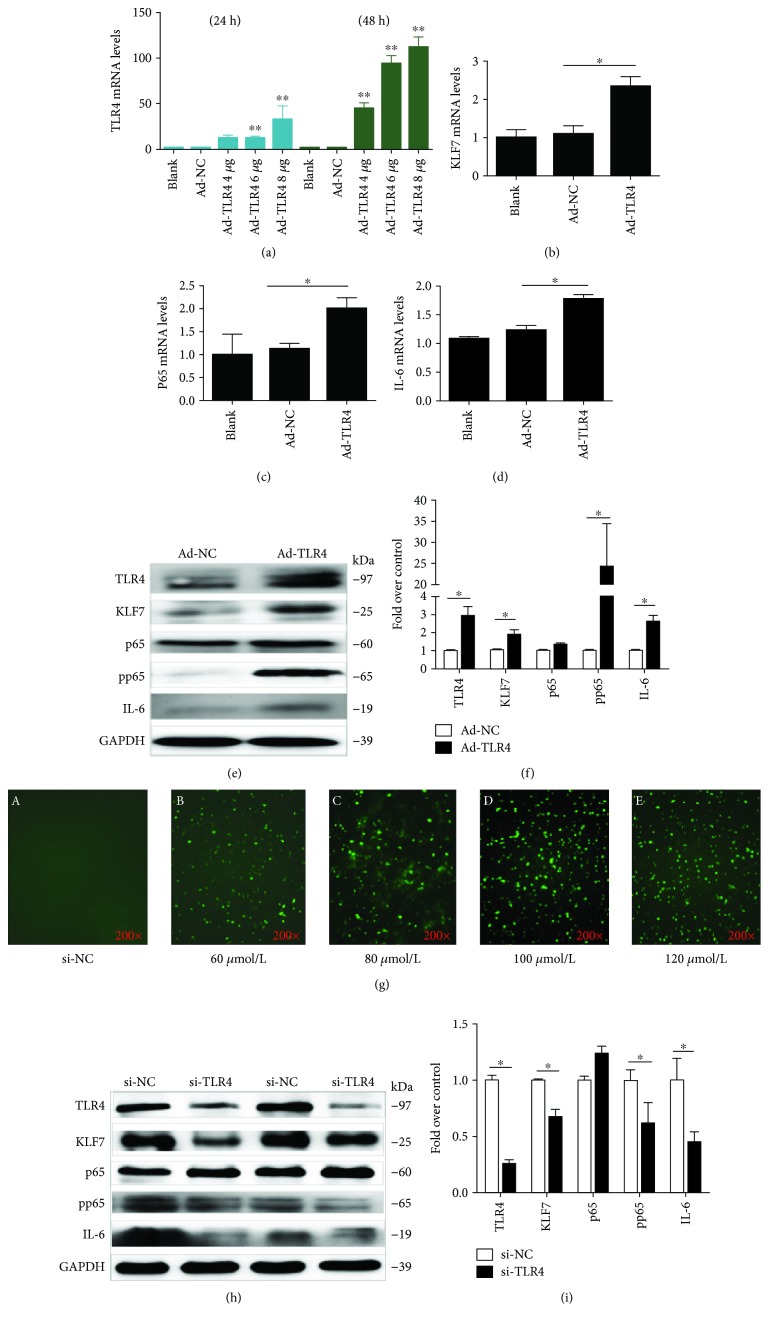
Figure 2.
The TLR4 expression level in cells after 24 h and 48 h upregulation of the TLR4 overexpression plasmid (a). The mRNA expression of KLF7, p65, and IL-6 in adipocytes was detected after 48 h of upregulation of the TLR4 expression (b–d). The protein expression levels of KLF7, pp65, and IL-6 in adipocytes after 48 h upregulation of the TLR4 expression (e). The transfection efficiency after 8 h transfection with different concentrations of si-FAM fluorescent fragments into adipocytes (g). The protein expression levels of KLF7, pp65, and IL-6 in adipocytes after 48 h downregulation of the TLR4 expression (h). Grayscale scanning of proteins from (e) and (h) (f, i) (Ad-TLR4: transfected TLR4 overexpression plasmid, Ad-NC: transfected TLR4 negative control overexpression plasmid, siTLR4: transfected siRNA of TLR4, and siNC: transfected negative control of siRNA). The data for each group is derived from three replicates of experimental data. One-way ANOVA (a–d), T test (f, i), ∗P < 0.05, ∗∗P < 0.01; the difference was statistically significant.

