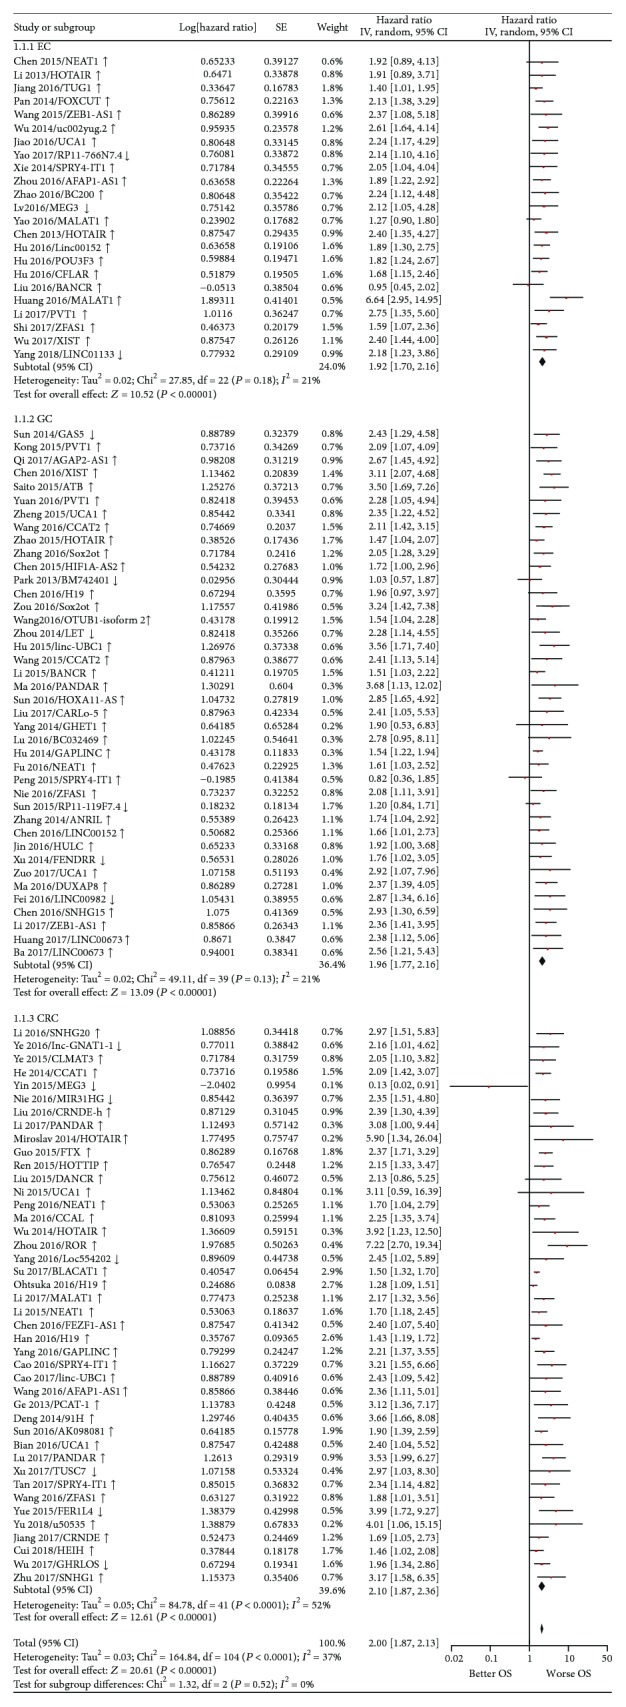
Figure 3.

Forest plot showing the pooled HR (95% CI) of OS related to the expression level of different lncRNAs in gastrointestinal cancer patients. (1.1.1) Specific lncRNA expression in EC (esophageal cancer); (1.1.2) specific lncRNA expression in GC (gastric cancer); (1.1.3) specific lncRNA expression in CRC (colorectal cancer). HR: hazard ratio; CI: confidence interval; OS: overall survival.
