FIGURE 2.

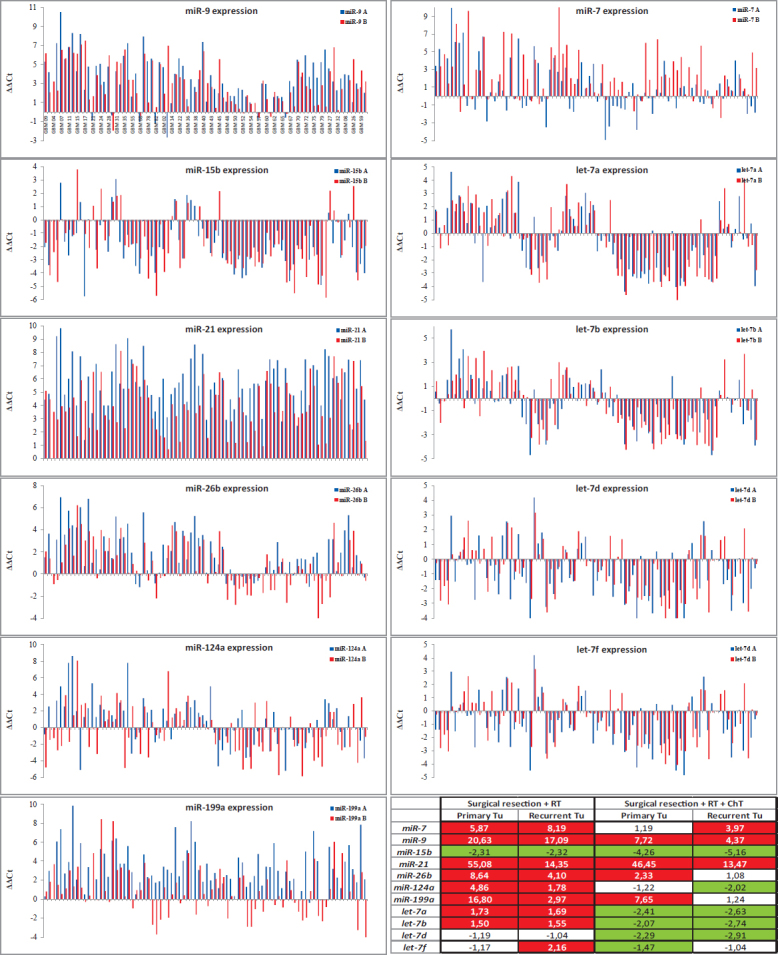
Expression of miRNAs in primary and recurrent GBM (compared to the Human Brain Reference RNA, ΔΔCt) with Table presenting Average Fold Changes.
ChT = chemotherapy; RT = radiotherapy; A = primary GBM; B = recurrent GBM

Expression of miRNAs in primary and recurrent GBM (compared to the Human Brain Reference RNA, ΔΔCt) with Table presenting Average Fold Changes.
ChT = chemotherapy; RT = radiotherapy; A = primary GBM; B = recurrent GBM