
FIGURE 3.
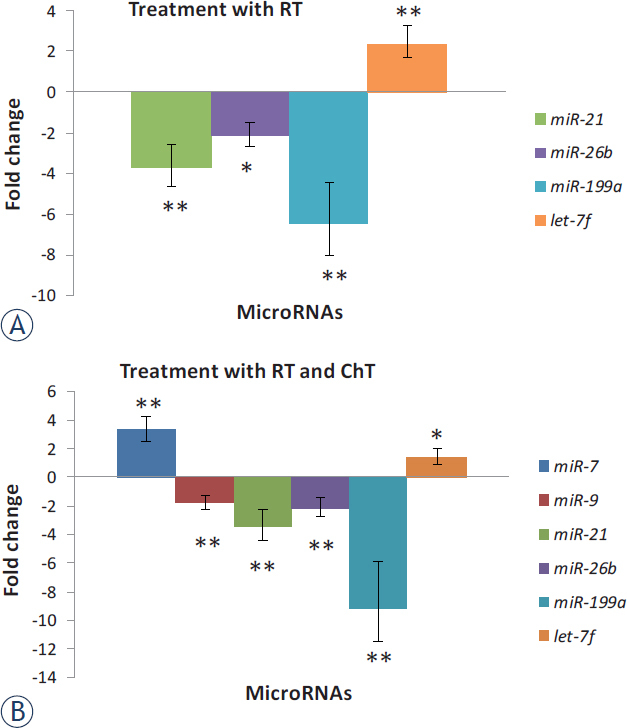
Expression of miRNAs in recurrent glioblastoma (GBM) after treatment compared to expression in primary GBM. Results are represented separately for patients treated with RT and those treated with RT and ChT.
ChT = chemotherapy; RT = radiotherapy; * = significant differences in expression of miRNAs, p < 0.05; ** = p < 0.01