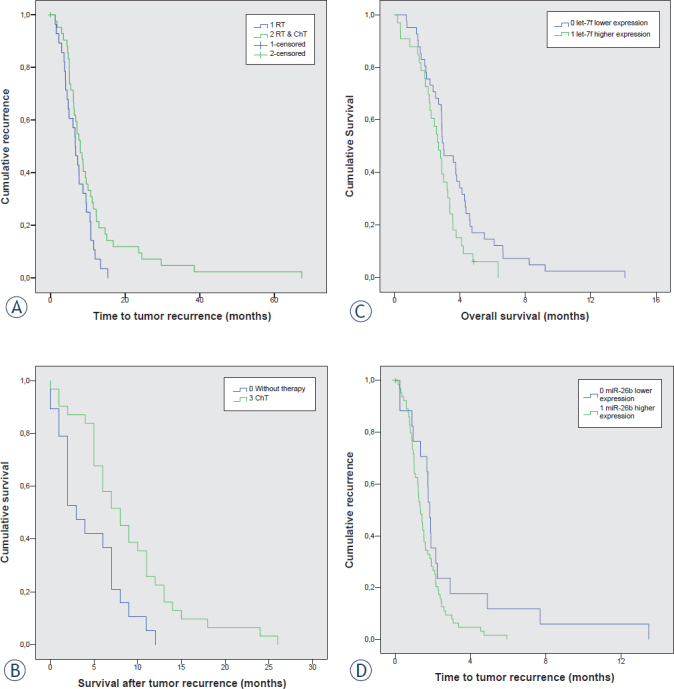
FIGURE 5.

Survival curve analyses; (A) Progression free survival between patients that received RT alone or both, RT and ChT; (B) Survival time after second surgery for patients who received no therapy versus patients who received ChT; (C) Progression free survival between patients with up- and downregulated miR-26b; (D) Progression free survival between patients with up- and downregulated let-7f.
ChT = chemotherapy; RT = radiotherapy
