Figure 4.

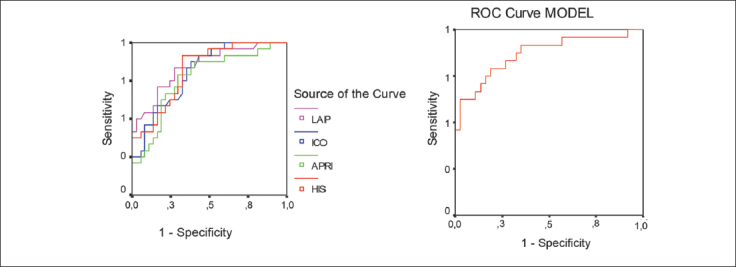
A. ROC curve is showing the ability of NAFLD indices and ICO to predict cardiovascular risk, B. ROC curve of model (integrated ICO, LAP, APRI and HIS indices) to predict cardiovascular risk.

A. ROC curve is showing the ability of NAFLD indices and ICO to predict cardiovascular risk, B. ROC curve of model (integrated ICO, LAP, APRI and HIS indices) to predict cardiovascular risk.