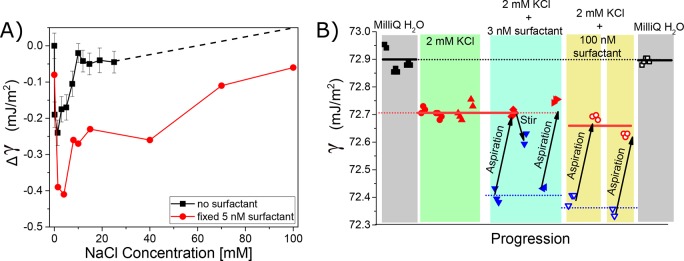
Figure 2.
Effect of surfactant impurities on the surface tension of salt solution. (A) Surface tension data of a salt concentration series for NaCl added to ultrapure water (black trace)20,21 and a concentration series of NaCl added to a solution of 5 nM NaDBS. (B) Surface tension values for different aqueous solutions and aspiration/stirring cycles: ultrapure water (gray areas), 2 mM of KCl added to ultrapure water with stirring/aspiration (green), and 3 (100) nM NaDBS added to 2 mM KCl solution shown in cyan (yellow) area. Stirring/aspiration brings back the surface tension value to the pure 2 mM KCl solution value but not to the value of pure water (gray). Blue triangles (open and filled) show data points after stirring and before aspiration, whereas red and black (open and filled) data points show measurement after aspiration. Note that measurements of different sample solutions with identical composition are indicated with differently shaped data points. Thus the former measures the impurity contamination, and the latter measures the surfactant-free interface.

