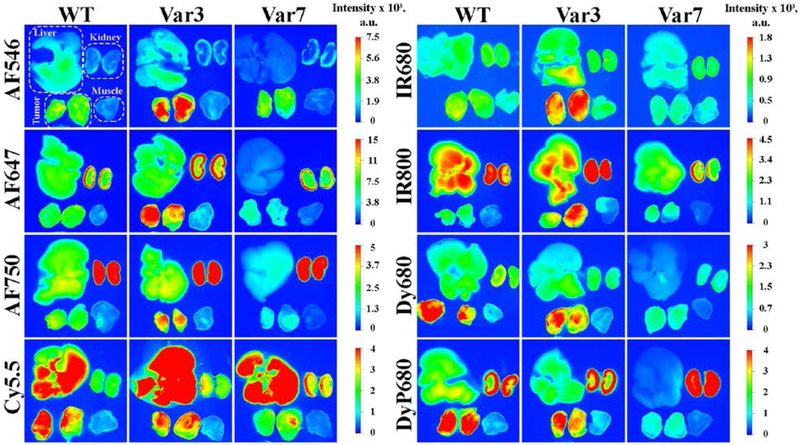
Figure 1. Time-dependent distribution of the fluorescent pHLIP® peptides in 4T1 mammary tumors, kidney, liver and muscle quantified by the ex-vivo surface fluorescence.
The mean values of the normalized fluorescence and St.d. calculated for each fluorescent pHLIP® variant (WT – green, Var3 – red, Var7 – blue) at each time point are presented. Normalization was performed to the intensity in tumor of the corresponding fluorescent WT pHLIP® peptide at 2 hours p.i.. The numerical values of the non-normalized fluorescent intensities and number of animals used for each fluorescent pHLIP® variant at different time points are given in the Supplementary Table 1.

