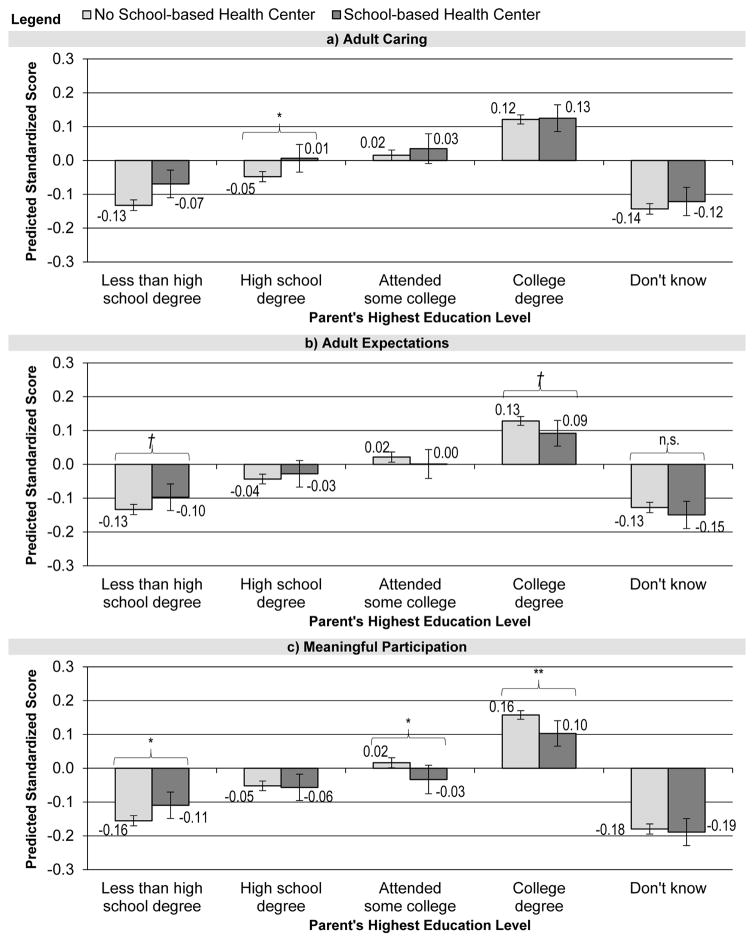
Figure 1. Predicted Standardized School Connectedness Scores for Students With and Without School-based Health Centers by Parent’s Highest Education Level (N=300,000): California Healthy Kids Survey, California, 2013–2014.
Note. Predicted scores were estimated from multilevel linear regression models and averaged across level 1 and level 2 variables. P-values were calculated using Stata’s post estimation lincom command, which estimated p-values from linear combinations of coefficients based on the final models with the cross-level interactions. † p < .10; * p< .05; ** p < .01

