
Figure 1.
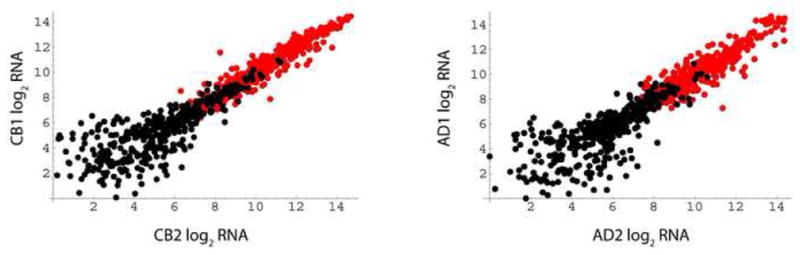
Differentiation-induced genes in cord blood and adult cells. RNA samples were isolated from fresh MO and day 6 DC. Shown are comparisons of two cord blood donors (left panel) or two adult donors (right panel). Data from Affymetrix expression microarrays were filtered to depict RNAs induced by differentiation in both individuals: thresholds were an ≥8-fold increase and a minimum level in dendritic cells of ≥150 arbitrary units. Axis scales are log (base 2) values of arbitrary units. Black circles, monocyte values (n = 406, average log (base 2) induction = 4.8); red circles, dendritic cell values (n = 367, average log (base 2) induction = 4.7).