
Figure 3.
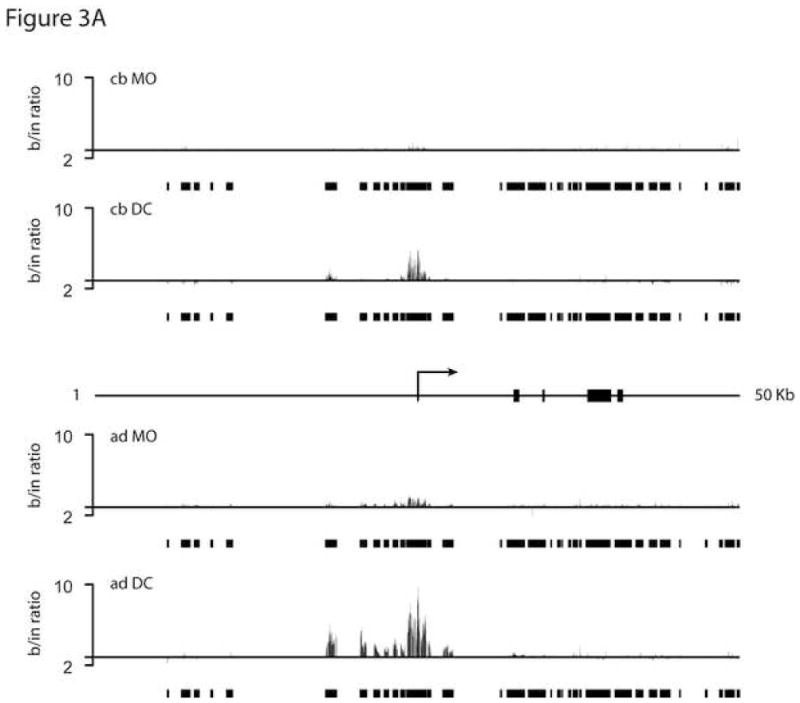
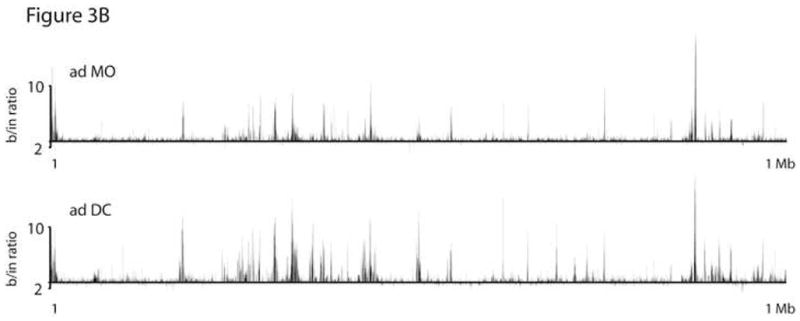
ChIP-on-chip analysis of the TLR3 locus. Chromatin was prepared from purified MO and in vitro-differentiated DC, followed by chromatin immunoprecipitation using a polyclonal anti-acetylated H3/H4 antibody. AD and CB samples were amplified, labeled, and hybridized to a custom designed oligonucleotide-array (Agilent) using standard protocols. (A) Relative levels of H3/H4 acetylation shown as ratios of bound DNA signal to input. Bars depict positions of probes represented on the chip. Arrow and rectangles indicate TLR3 transcriptional start site and exons, respectively. Data show results for the 50 Kb region that spans positions 187202303–187252303 on chr4 (NCBI build 36). (B) Relative levels of acetylation across a 1 Mb control region centered around the H10 gene; positions 36031120–37031120 on chr22.