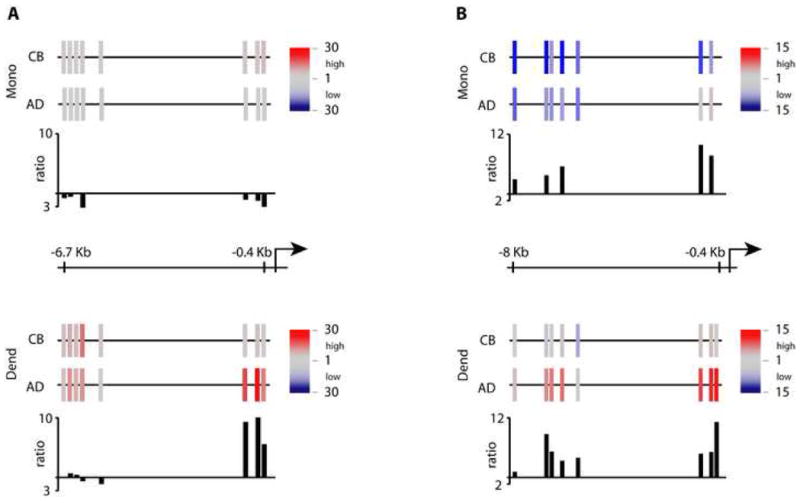
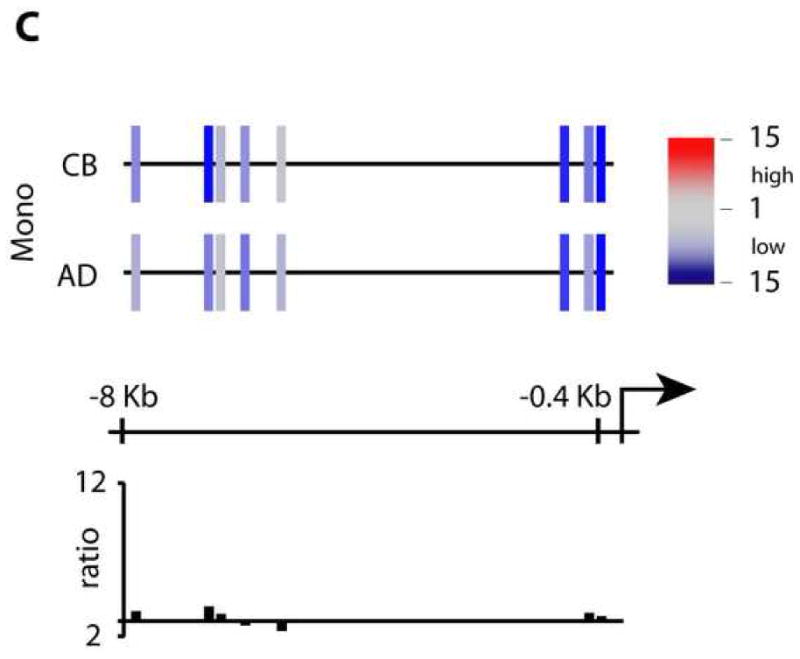
Figure 4.


ChIP-HPLC studies on the TLR3 locus. Chromatin was prepared from purified MO and in vitro-differentiated DC, followed by chromatin immunoprecipitation using an anti-acetylated H3/H4, anti-dimethyl H3K4 or an anti-dimethyl H3K9 antibody. Graphs for AD and CB samples represent the mapping of a region between the transcriptional start site and 6.7kb upstream on the TLR3 locus on chr4. (A) Schematic representation of H3/H4-acetylation levels. Color-encoded bars indicate primer pair target positions and relative acetylation levels according to the key at right. Bar graphs below represent H3/H4-acetylation ratios between CB and AD cells. (B) dimethyl-H3K4 ChIP. C: dimethyl-H3K9 ChIP.
