
Figure 5.
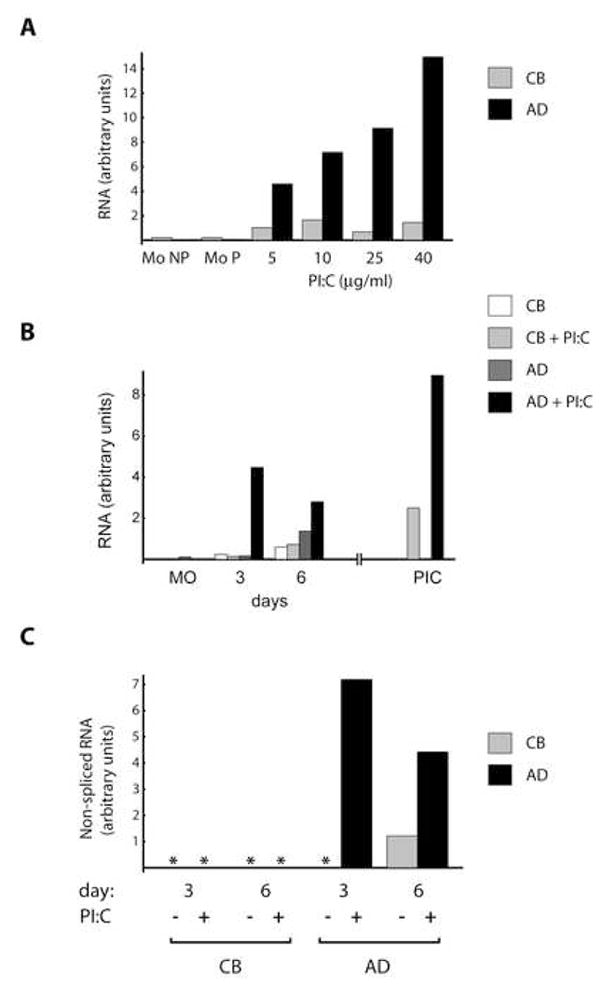
PI:C increases levels of TLR3 in AD but not CB cells. (A) Freshly isolated AD and CB MO were plated in RPMI supplemented with 10% FBS and PI:C was added in the amounts indicated. Total RNA was isolated 14 h post-plating. Samples from plated (Mo P) and non-plated (Mo NP) cells were included in the analysis. TLR3 mRNA levels were determined using real time PCR (TaqMan) and standardized by levels of GAPDH mRNA. Gray bars, CB; black, AD. (B) Cells obtained as in A were plated (MO) in RPMI, 10% FBS and IL-4/GM-CSF. Fresh cytokines were added every 48h to all cells and half of the samples were also treated with 20 μg/ml PI:C. Additionally, AD and CB MO were maintained in IL-4/GM-CSF for 7 days to complete DC differentiation; PI:C was then added for 14 h, followed by RNA purification (PIC). TLR3 mRNA levels were determined as in A. White bars, CB cytokines only; light gray, CB PI:C treated; dark gray, AD cytokines only; black, AD PI:C treated. (C) TLR3 transcriptional rates determined by a nested two stage intron-exon assay for nascent RNA. Stage one PCR targeted a TLR3 intron-exon boundary; stage two employed a custom real time TaqMan assay using nested primers. TLR3 RNA levels were standardized against levels of GAPDH. Results are expressed in relative units. Gray bar, CB; black, AD. Asterisks indicate no signal detected.