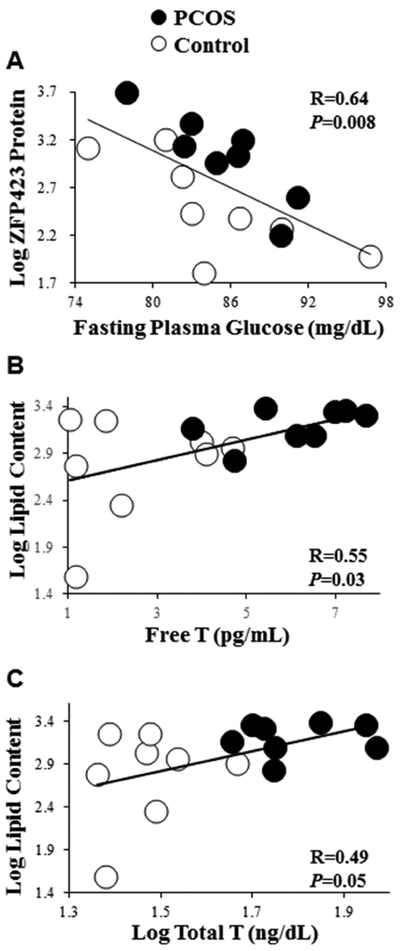
Figure 3:

Correlations of log ZFP423 protein expression (day 0.5) with (A) fasting plasma glucose levels, and of log lipid content (day 12) with (B) serum free T and (C) log serum total T levels in 8 age and BMI pair-matched normal-weight PCOS and control women. ZFP423 protein expression and lipid content values are expressed as Texas Red and Oil-Red-O fluorescence, respectively, divided by DAPI.
