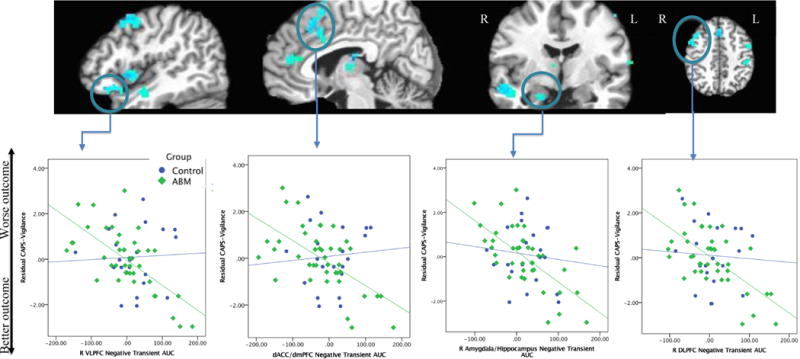
Figure 2.

Clusters where negative transient AUC values predict CAPS-Vigilance residual scores (from whole-brain analysis). From left to right, panels display the following clusters from Table 2 whole-brain analysis: 1) R VLPFC, R insula/IFG, R middle/superior temporal cortex, R DLPFC; 2) pgACC, dACC, thalamus; 3) R middle/superior temporal cortex, R amygdala/hippocampus, thalamus; 4) R DLPFC, dACC/dmPFC, L DLPFC, L dorsal postcentral gyrus. Lower row of figures depicts representative linear relationships between negative transient AUC values from selected ROIs and residual CAPS-vigilance scores in the ABM and control groups.
