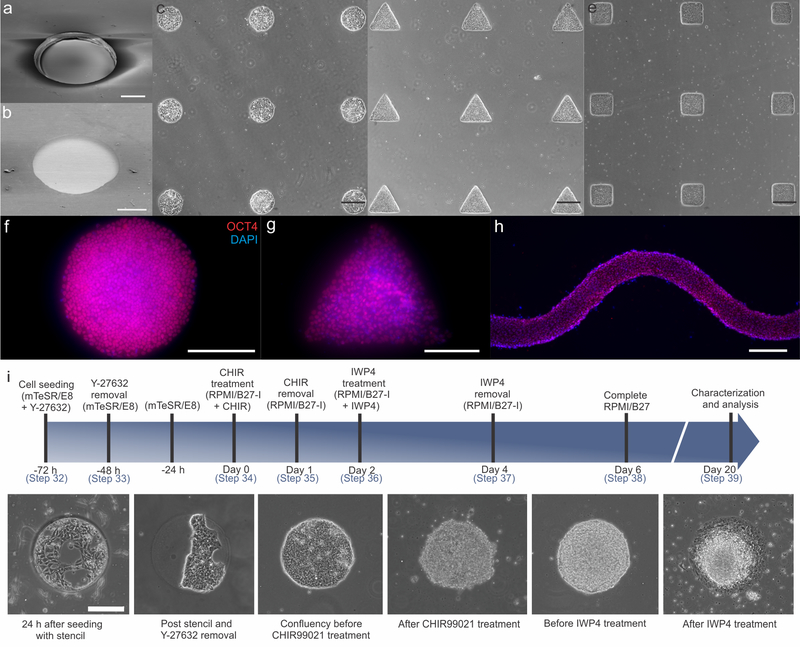
Figure 2. Resulting patterns and seeded cells after oxygen plasma etching.
SEM images of (a) PDMS stencil with clear-through holes (Steps 8–12) and (b) etched PEG surface (Steps 13–20) with circular patterns. (c-e) hiPSCs patterned into an array of circles, triangles and squares, respectively. (f-h) Patterned hiPSCs still maintain pluripotency as indicated by OCT4 expression. (i) Timeline of the differentiation procedure and cell morphologies at key stages of differentiation. Scale bars: 200 μm (a, b, f-i); 400 μm (c-e).

