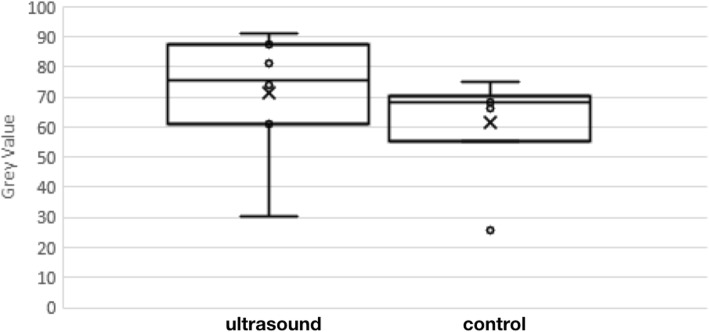
Fig. 9.
Gray-scale value that measures extent of myelin on the left side of mouse brain to which ultrasound was applied compared to that of the right (control) side. Note higher values denote more myelin. This difference in myelin between brain hemispheres had statistical significance (n = 7; two-sided, paired Student’s t-test, p < 0.02) with a substantial effect size (t score = 3.02)

